In VertiGIS FM Energy, metering points are data objects with which your meters, tariffs, and other objects used to measure energy consumption are associated. They allow you to analyze your energy consumption and the associated costs at a site. For example, you may create a metering point to measure the electricity used in the lobby of your office building for the month of January, and how much money the business will be billed for this energy consumption.
Metering points can be associated with a building or room in the metering point details. Typically, you create multiple metering points throughout a building or site to track the energy consumption at different points within it.
You can also assign a metering point to a service area, contract, or rental unit, as well as to other data objects managed in various VertiGIS FM products.
Metering Point Details Page
Each metering point has a details page that stores data associated with it. On the metering point details page, you can view and analyze its energy consumption, which is generated by its meter and consumption entries, and the associated costs, which is are generated by the tariffs applied to the metering point.
You can access a metering point details page from the VertiGIS FM Energy search page. Under Objects, click Metering Point. In the search grid, double-click the metering point whose details page you want to open.
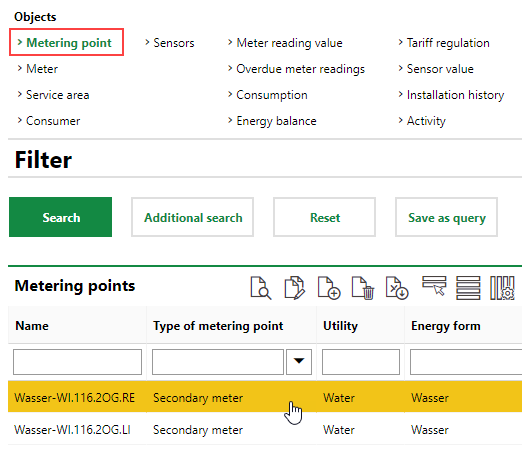
Opening a Metering Point Details Page
The metering point details page opens.
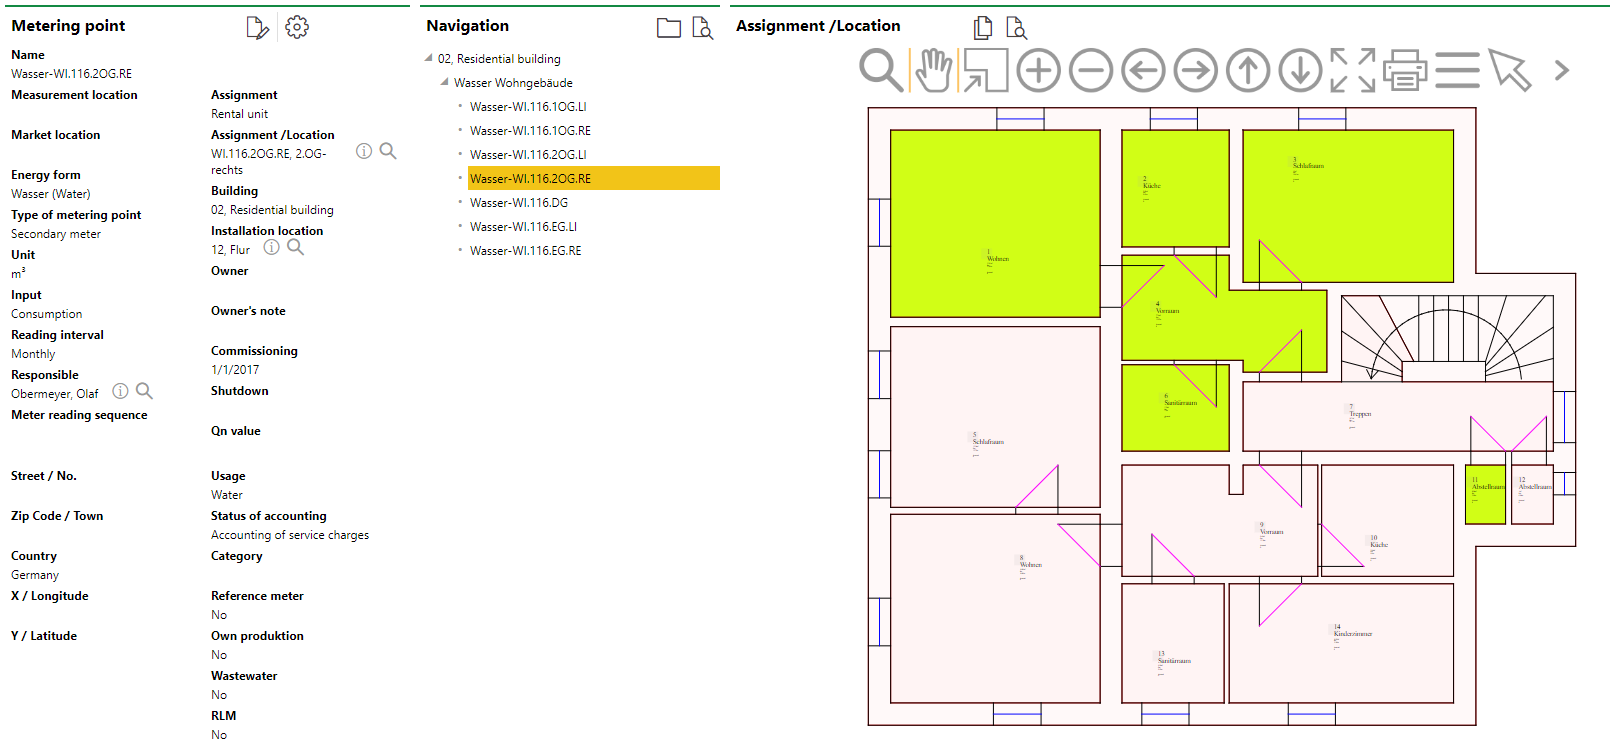
Metering Point Details Page
Metering Point Details
The metering point details page stores the data fields below.
Metering Point Details
Field |
Description |
||||||||||
|---|---|---|---|---|---|---|---|---|---|---|---|
Name |
The name assigned to the metering point. |
||||||||||
Measurement location |
In Germany, a 33-character alphanumeric reference code for the metering point's location. |
||||||||||
Market location |
In Germany, an identification number that represents a market location in which the energy is being consumed. This information may be required in conjunction with the measurement location. |
||||||||||
Energy form |
The type of energy captured by meters associated with the metering point. You Selectable options are stored in the Energy Form catalog. You cannot edit this property after you create the metering point. |
||||||||||
Type of metering point |
The metering point's place in a hierarchy. You cannot edit this value manually. It is assigned to the metering point after you create it and updates based on changes to its hierarchical relationship to other metering points.
|
||||||||||
Unit |
The unit of measurement captured by meters associated with this metering point. This field populates automatically based on the Energy Form selection. The unit associated with each energy form is managed in the Energy Form catalog. |
||||||||||
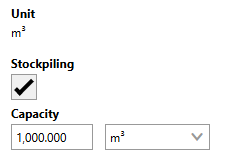
Stockpiling |
A check box that, if selected, means the metering point stores its own energy form. This check box is only available if the an energy form whose Utility is Heat is selected in the metering point's Energy Form field. If you select this check box, •a Capacity field section becomes available in the metering point details. This field indicates the amount of heat that can be stored at the metering point.
•an Acquisition section in which you can register purchases of amounts of the energy form up to the amount specified in the metering point's Capacity field becomes available on the the metering point details page. Refer to Purchase and Store Energy for more information. You cannot select or deselect this check box when editing the metering point details. The selection must be made when you create the metering point. |
||||||||||
Capacity |
The amount of the energy selected in the metering point's Energy Form that can be stored at the metering point. You can enter a value in the text box and select a unit of measurement associated with the metering point's energy form. This field is only available if the an energy form whose Utility is Heat is selected in the metering point's Energy Form field and if the Stockpiling check box is selected. |
||||||||||
Input |
How data for energy consumption at the metering point is entered into VertiGIS FM.
Refer to Consumption for more information. |
||||||||||
Reading Interval |
How often readings of the meter associated with the metering point occurs. You can select monthly, quarterly, or annually. This selection is required to inform the system of how to intercalate missing meter reading values. If you select monthly, for example, VertiGIS FM will intercalate meter readings for each month that does not have a meter reading on the first. Refer to Required Readings for more information. Based on the selection in this field, VertiGIS FM also prepopulates dates in the From and Until fields when you add a consumption. |
||||||||||
Responsible |
The person responsible for the metering point. You can select a contact or a company stored in the Contact Management module. |
||||||||||
Meter reading sequence |
A number that indicates the assigned meter's place in a sequential order in which meters should be read. This property can be used to order metering points that are part of the same metering point hierarchy. |
||||||||||
Assignment |
The type of data object to which the metering point is assigned. This field populates programmatically based on the data object selected in the Assignment/Location field. |
||||||||||
Assignment /Location |
The greater location to which the metering point is assigned. Typically, a real estate or building is selected in this field. Refer to Buildings Hierarchy for more information. You can click the |
||||||||||
Installation location |
A more specific location to which the metering point is assigned. Typically, a room is selected here. Refer to Buildings Hierarchy for more information. You can click the |
||||||||||
Owner |
The person who owns the metering point. You can select a contact or a company stored in the Contact Management module. |
||||||||||
Owner's note |
An information field in which you can enter additional information about the metering point's ownership. |
||||||||||
Commissioning |
The date the metering point has been in use since. |
||||||||||
Shutdown |
The date the metering point will be or was deactivated. |
||||||||||
Qn value |
The nominal flow rate. This field is only visible when you select a fluid energy form like water or gas in the Energy Form field. The Qn Value defines the diameter of the pipes and determines how much the customer pays to maintain a pressure level. The value entered here is paired with the Flow Rate value in the meter details of meters assigned to this metering point. |
||||||||||
Country |
The country in which the metering point is located. You must select an activated country on the Country Management administration page. |
||||||||||
Zip Code |
The ZIP code or postal code of the metering point's location. |
||||||||||
City |
The city in which the metering point is located. |
||||||||||
Street |
The street on which the metering point is located. |
||||||||||
Number |
The street address of the metering point's location. |
||||||||||
X / Longitude |
The x-coordinate (longitude) of the metering point on the geographic coordinate system. |
||||||||||
Y / Latitude |
The y-coordinate (latitude) of the metering point on the geographic coordinate system. |
||||||||||
Usage |
The type of energy the energy purchased (indicated by the Energy Form field) is used to produce. For example, you could be purchasing electricity to produce heating or cooling. Selectable options are managed in the Utility catalog. |
||||||||||
Consumer |
The data objects to which you can assign the metering point. This field is only available if you assign a building asset in the metering point's Assignment/Location field. Selectable options are •Room |
||||||||||
Status of accounting |
A setting that reflects whether the metering point is associated with accounting services managed in VertiGIS FM. |
||||||||||
Category |
A field that can be used to further categorize the metering point. Selectable options are stored in the Category catalog. |
||||||||||
Reference meter |
A check box that, if selected, allows you to compare the values recorded for this metering point with those of another metering point. |
||||||||||
Own production |
A check box that, if selected, indicates you produce the energy measured by this metering point. For example, if the metering point measured electricity generated by solar panels on your roof, you could select this check box. |
||||||||||
Wastewater |
A check box that, if selected, indicates the metering point is associated with waste water usage. The type of water used affects the accounting of the water usage. |
||||||||||
Infeed |
A check box that, if selected, causes the Hand Over section to appear on the metering point details page. This check box is only selectable if the catalog entry for the energy form selected in the Energy Form field has the Feed in is possible check box selected. |
||||||||||
RLM |
Recording Performance Management. A check box that can be selected to indicate that the metering point measures higher-than-normal energy consumption. You only need to select this check box if the metering point's Energy Form is Heating. If you select this check box, a Power [kW] text box is added to accounting entry form so that you can register a peak power level when you create an accounting entry. |
||||||||||
Description |
A free-form text field in which you can enter additional details that describe the metering point. |
The street address information entered in the Zip Code, City, Street, and Number fields are used to display the location of the asset on the Open Street Map (OSM), if it is activated.
Navigation
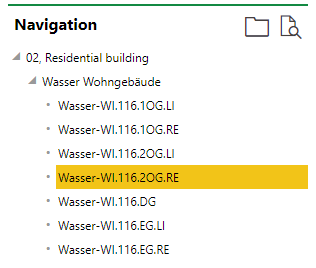
The Navigation section displays a tree diagram that indicates
•the VertiGIS FM Buildings asset selected in the Assignment Location field as the top level in the tree, if applicable.
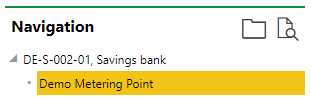
•the metering point whose details page you are viewing highlighted in yellow.
•Any subordinate or superior metering points that have been associated with the metering point whose details page you're viewing in the Hierarchy section.
Metering Point with a Superior Metering Point in the Hierarchy |
Metering Point with No Hierarchy |
The tree also shows any meters assigned to the metering point, if applicable. You can double click the meter to navigate to its details page.
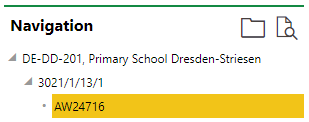
Meter Assigned to Metering Point
Installation Location/Map
The section to the right of the Navigation section may indicate Installation Location or Map, depending on whether the metering point any CAD files for the floor on which the metering point is located have been imported into VertiGIS FM or whether the location of the metering point can be displayed on a map.
If both a CAD file and a map are available for the metering point, you can toggle between them by clicking the ![]() and
and ![]() icons.
icons.
Toggle to Installation Location |
Toggle to Map |
Installation Location
The Installation Location section if visible if the room you select in the Installation Location field in the metering point details is on a floor for which a CAD file has been imported. The room selected is highlighted on the CAD drawing.
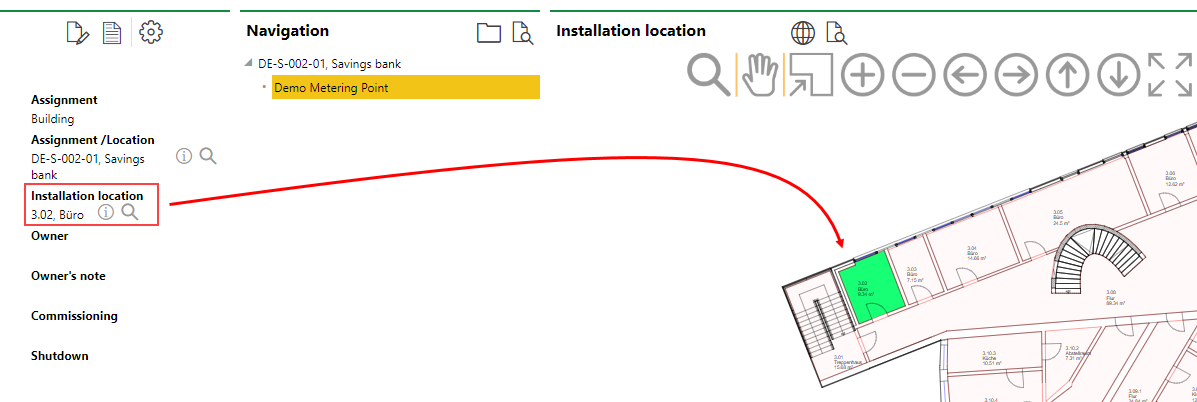
Installation Location for a Room Whose Floor Has a CAD Drawing
Map
If the Map section is available on the metering point details page, the metering point's location is shown on one of two maps:
•on a web map from a VertiGIS Studio application that has been integrated with VertiGIS FM.
•on the Open Street Map (OSM), a basic map that shows the location of assets using location and address data stored in the VertiGIS FM database. The OSM is available for all clients who do not have any VertiGIS Studio projects.
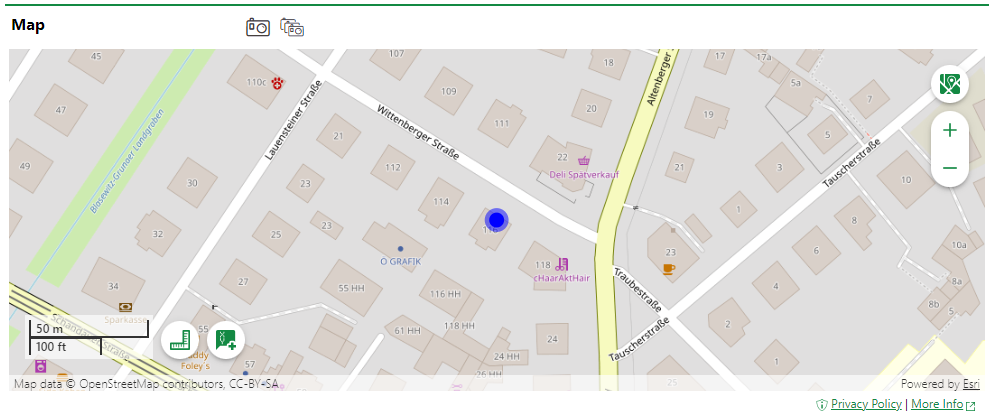
Asset Location Shown Using the Open Street Map
If the OSM is activated and does not appear on the metering point's details page, ensure the metering point is associated with a street address. The location of a metering point is displayed based on the address entered in the metering point details.
Refer to Open Street Map Viewer for information about viewing your assets on the OSM.
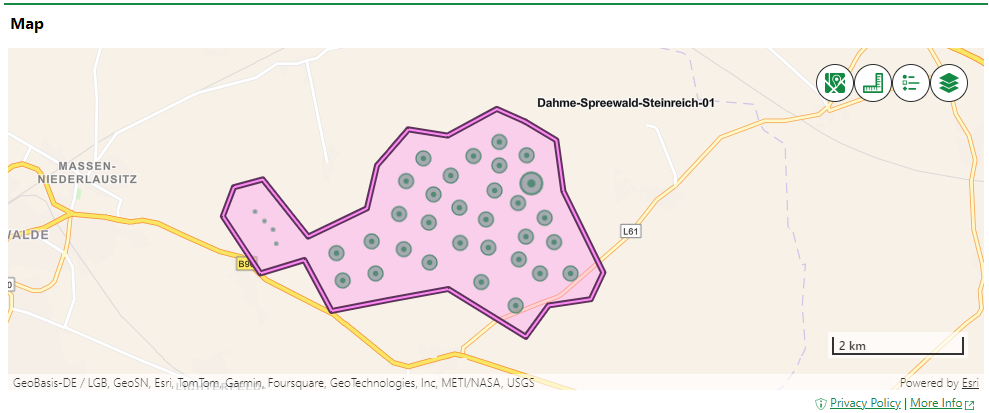
Building and Maintenance Assets Shown on an Integrated VertiGIS Studio Web Map
If your organization has integrated its own VertiGIS Studio web map with VertiGIS FM and mapped a layer to metering points, you can click the Locate (![]() ) icon on the metering point details page to manage the GIS feature associated with the metering point.
) icon on the metering point details page to manage the GIS feature associated with the metering point.

Locate Icon on the Device Details Page
Clicking the Locate button opens the Edit Object workflow. This allows you to move the location of the metering point's corresponding feature in the GIS, unlink the metering point and the feature so that changes to the item in the GIS are not reflected in the VertiGIS FM database (and vice-versa), or delete the GIS feature so that the metering point only exists as an object in VertiGIS FM.
The Maps section does not appear on the metering point details page if metering points are not mapped to any layers in an integrated VertiGIS Studio web map and the Open Street Map (OSM) is not activated.
Hierarchy
The Hierarchy section reflects the metering point's place in a submetering hierarchy (for example, whether it is a building's master metering point or a submeter whose readings are included in the master metering point's total consumption). A metering point's place in a submeter hierarchy determines its Type of Metering Point value in the metering point details.
The Type of Metering Point detail is reflected in the State column in the Hierarchy section on the metering point details page.

Hierarchy Section on the Metering Point Details Page
Refer to Create Metering Point Hierarchies for more information about submeter hierarchies, including instructions on how to create them.
You can see a visual outline of existing submeter hierarchies for all metering points in the system by accessing the Strand Diagram. You can see a visual representation of submeter hierarchies within a building, service area, or metering point and the energy flow between their main meters and the downstream submeters by accessing the Sankey Diagram.
Tariffs
The Tariffs section reflects the tariffs that have been assigned to this metering point. The tariffs include rates for energy consumption that are applied to the consumption to calculate their costs.

Tariff Section on the Metering Point Details Page
You can select a tariff assigned to the metering point and click the View Details (![]() ) icon to see the tariff details, including the rates it is applying to the metering point's consumption to calculate its costs. You can click the Further Editing (
) icon to see the tariff details, including the rates it is applying to the metering point's consumption to calculate its costs. You can click the Further Editing (![]() ) icon to assign a tariff to the metering point and to schedule the end of a tariff's assignment to the metering point.
) icon to assign a tariff to the metering point and to schedule the end of a tariff's assignment to the metering point.
A metering point can only have one active tariff applied to it at a time. Tariffs cannot overlap in the From and Until dates.
Refer to Tariffs for more information.
Consumption
The Consumption section lists monthly consumption and cost statistics for energy consumed at the metering point.

Consumption Section
Refer to Consumption for more information.
The Consumption section is renamed Hand Over if the Infeed check box is selected in the metering point details.
Meter Readings
The Meter Readings sections stores meter readings if the metering point is used for energy storage. Typically, meter readings are stored in the Meter Readings section on the meter details page for the meter assigned to the metering point. If the Stockpiling check box is selected in the metering point details and if you have purchased energy for the metering point (i.e., the the Acquisition section has entries), you can enter meter readings directly on the metering point.
Meter readings must descend from the amount purchased for storage, which can be up to the amount in the metering point's Capacity field. The first entry in this section will always indicate 0.00, which is the amount before any energy is purchased.
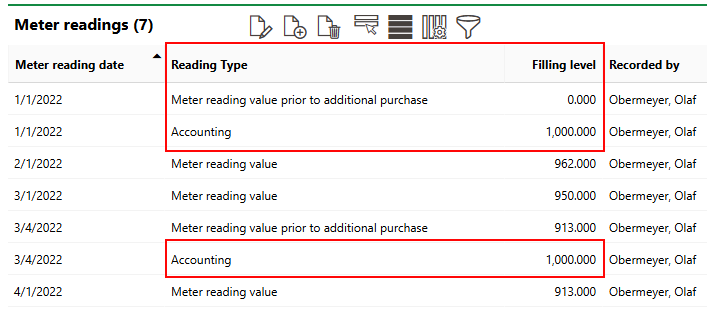
Meter Readings Section
In the example above, energy is purchased to the metering point's capacity on January 1 and March 4, 2022.
Refer to Purchase and Store Energy for more information.
Acquisition
The Acquisition lists the energy purchases that have been made for the metering point's storage. This section is only available if the Stockpiling check box is selected in the metering point details.

Acquisition Section
Energy up to the amount specified in the metering point's Capacity field can be entered. Refer to Purchase and Store Energy for more information.
Chart Consumption
The Chart Consumption section displays monthly consumption data for the selected fiscal year in a graph. This section only appears if the metering point has entries in the Consumption section and if VertiGIS FM is set to the same fiscal year in which the consumption entries are registered.
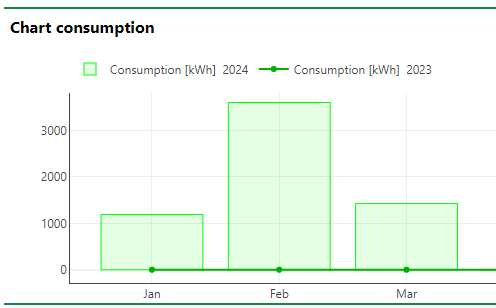
Chart Consumption
The bars along the x-axis indicate the monthly energy consumption for each month. The trend line indicates the consumption levels at the same times for the previous year. You can hide the consumption levels from the current or previous year by clicking the buttons above the graph.
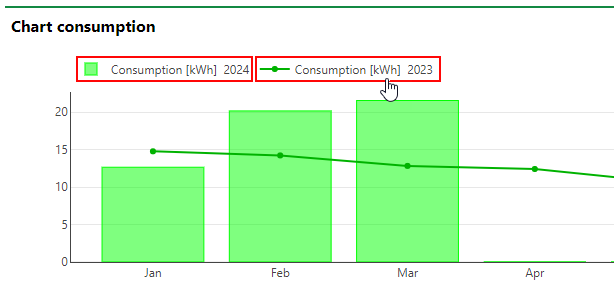
Chart Consumption for Metering Point with Data for Previous Year
You can interact with the chart(s) outlined above using the controls in the top-right corner.
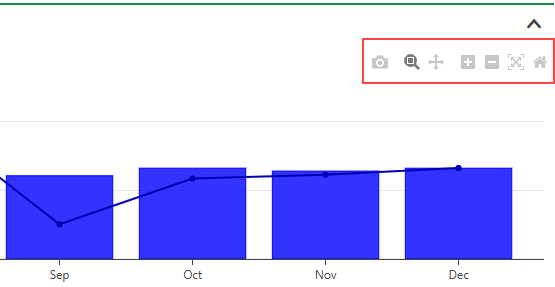
Consumption Chart Controls
Consumption Chart Controls
Icon |
Function |
|---|---|
|
Download a .png image file of the chart to your computer. |
|
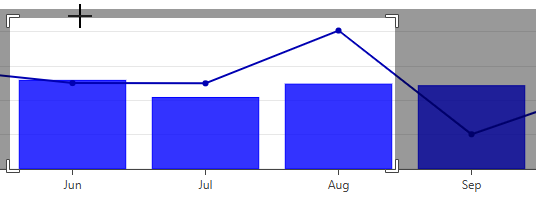
Allows you to draw a square on the chart by clicking and dragging. When you release the mouse, the chart zooms in to the selected area.
Selected Chart Area This tool is selected by default. You only have to click the icon before drawing an area if you have clicked another one of the icons. |
|
Move the focused area of the chart up, down, to the left, or to the right by clicking on the chart and dragging. |
|
Center and zoom in on the chart. |
|
Center and zoom out on the chart. |
|
Scale the chart to fill the width of the chart area. |
|
Undo any zooming, panning, or scaling so that the chart is centered and scaled. |
You can change the fiscal year to which your metering point environment is set by clicking the icon ![]() in the navigation bar at the top of the page.
in the navigation bar at the top of the page.
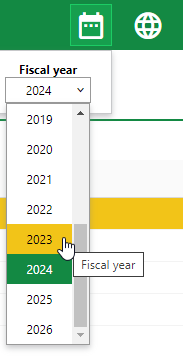
Fiscal Year
This selection determines which financial data is shown and which years you can set budgets for in the application.
If the current fiscal year does not appear in the drop-down menu, an administrator must add it in the fiscal year administration section.
Refer to Consumption for more information.
Chart Costs
The Chart Costs section displays the financial costs associated with the monthly consumption data for the selected fiscal year in a graph. This section only appears if the metering point has entries in the Consumption section and if VertiGIS FM is set to the same fiscal year in which the consumption entries are registered.. You must have a tariff assigned to the metering point or manually enter rates in the consumption entries to see the costs of the metering point's energy usage.
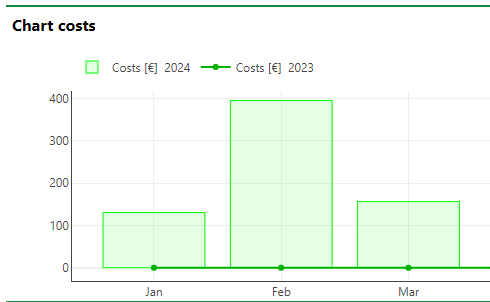
Chart Costs Section
The bars along the x-axis indicate the cost of each month's consumption. The trend line indicates the costs at the same times for the previous year. You can hide the consumption levels from the current or previous year by clicking the buttons above the graph.
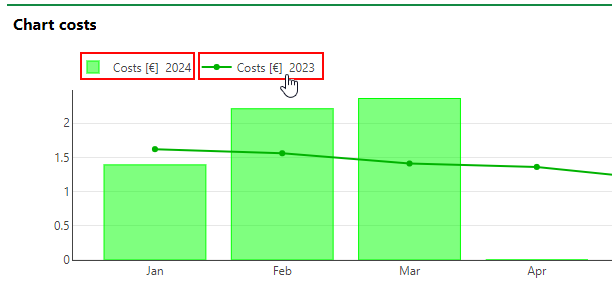
Chart Costs for Metering Point with Data for Previous Year
You can interact with the chart(s) outlined above using the controls in the top-right corner.

Consumption Chart Controls
Consumption Chart Controls
Icon |
Function |
|---|---|
|
Download a .png image file of the chart to your computer. |
|
Allows you to draw a square on the chart by clicking and dragging. When you release the mouse, the chart zooms in to the selected area.
Selected Chart Area This tool is selected by default. You only have to click the icon before drawing an area if you have clicked another one of the icons. |
|
Move the focused area of the chart up, down, to the left, or to the right by clicking on the chart and dragging. |
|
Center and zoom in on the chart. |
|
Center and zoom out on the chart. |
|
Scale the chart to fill the width of the chart area. |
|
Undo any zooming, panning, or scaling so that the chart is centered and scaled. |
Consumer
The Consumer section lists any service areas the metering point is assigned to. Refer to Service Areas for more information.
Meter
The Meter section lists the meters that have been assigned to the metering point.
The From and Until columns reflect which meters have been assigned to the metering point historically, with the Until column for the meter currently assigned to the metering point empty. Only one meter can be assigned to a metering point at a time.

Meter Section
The Meter section is not visible if the metering point's Input is set to Virtual in the metering point details.
You can double-click a meter, or select it and click the View Details (![]() ) icon, to navigate to its meter details page. You can also assign a meter to the metering point, or unassign an assigned meter, in this section.
) icon, to navigate to its meter details page. You can also assign a meter to the metering point, or unassign an assigned meter, in this section.
Virtual
The Virtual section stores entries that dictate how energy consumption should be calculated among different metering points that are part of the same metering point hierarchy. Click the Add (![]() ) icon to create a rule that determines how energy consumption should be calculated on the metering point details page for the main meter.
) icon to create a rule that determines how energy consumption should be calculated on the metering point details page for the main meter.

Virtual Section on the Metering Point Details Page
You cannot have multiple entries with different Type properties at the same time.
Refer to Virtual Consumption for more information.
Costs
Invoices created in theVertiGIS FM Cost and Budget module or in the Acquisition or Accounting sections on the metering point details page are listed here.
Notes
The Notes section lists notes that have been posted in relation to the metering point.
Documents
The Documents section lists the documents, including image files, associated with the metering point. Refer to Document Management for more information, including instructions on how to upload a document.
Tolerance
The Tolerance section shows the tolerances applied to the metering point. If the metering point's consumption exceeds the tolerance shown in this section, either by exceeding a rate of growth or decrease from the previous consumption period or by exceeding an absolute limit, VertiGIS FM generates a Variance that someone in your organization must review.
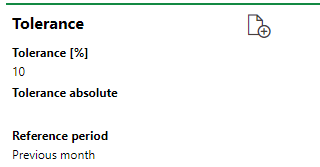
Tolerance Section
Tolerances are associated with the metering point's Usage property (or Utility) and applied to all metering points assigned the energy form. The Usage property is stored in the metering point details. If you want the metering point to have a tolerance that is different from the one associated with its Usage property, you can edit the tolerance for an individual metering point.
Refer to Plausibility Checks for more information.
Energy Planning
The Energy Planning section indicates the planned and actual energy consumption for the metering point for each year. If a year in this section is shown in red, it means the actual energy consumption is higher than the planned energy consumption. If the year is shown in green, it means the actual energy consumption is lower than the planned energy consumption.
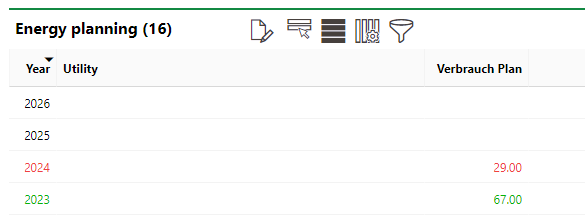
Energy Planning Section
If the year is not yet completed, only the planned consumption values for completed months with consumptions are shown. The year will still appear red or green in the section, based on whether the actual energy consumption is above or below the sum of the planned values for the months that have occurred.
Values shown in the Energy Planning section are in the units defined in the Unit field in the metering point details.
To set the planned energy consumption, you must specify how much energy you expect to be consumed at the metering point for each month of the year. Refer to Energy Plans for more information.
If any of the sections described in this topic do not appear on the details page, you may need to edit the section authorization to show them.
