Sankey diagrams are visualizations of values that move through different stages or statuses. The Sankey diagrams available in VertiGIS FM Energy depict the flow of energy throughout a submeter hierarchy. They show how much of the energy measured at the metering point for a main (or master) metering point is consumed downstream by intermediate metering points or submeters.
Refer to Stand Diagram for a more basic representation of metering point hierarchies in your implementation. Strand diagrams show superior and subordinate metering points without indicating their energy consumption flows.
To see the flow of energy consumption within a building, service area, or metering point, select a building in the Buildings section, a service area in the Service Areas section, or a metering point in the Metering Points section on the Energy Report page and click the Sankey (![]() ) icon.
) icon.

Sankey Diagram Icon
You can see Sankey diagrams for heating, electricity, or water consumption for a building, service area, or metering point you select on the Energy Report page. You can show or hide heat maps for a given energy form using the check boxes in the Medium section at the top of the page.
Filter Data
Sankey diagrams and the data they show vary based on the years entered in the From and Until text boxes in the Filter section at the top of the page. Available data also depends on the energy form associated with the selected data objects. Buildings and service areas can show comparisons between consumption data for different energy forms depending on the energy forms associated with their metering points. Because a metering point can only be associated with a single energy form, the energy report page for a metering point will only show data for its one energy form.
You can hide data for an energy form by deselecting its check box in the Medium section, or show the data by selecting it.

Energy Report Medium Check Boxes
Energy Flows
In VertiGIS FM Energy, Sankey diagrams show the metering point for the main (or master) meter on the left side of the diagram. The example below shows a metering point that measures heating consumption in kWh for a main meter with energy flowing to 18 submeters whose metering points are directly beneath the main one in the metering point hierarchy.
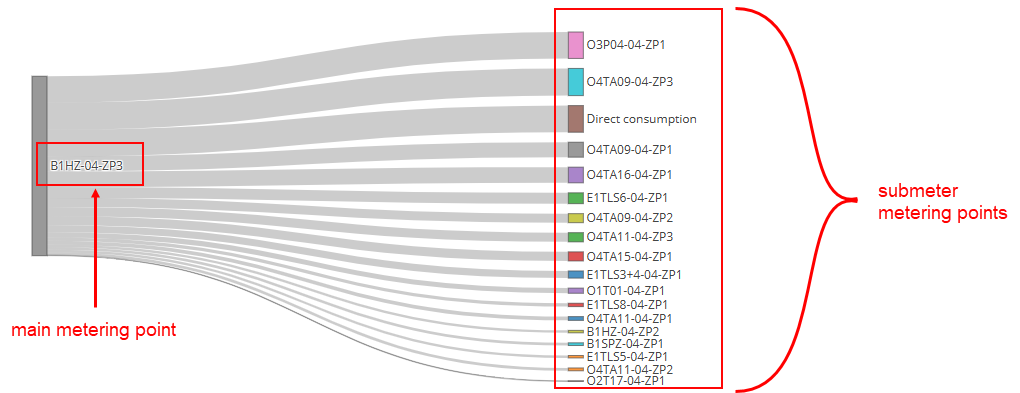
Basic Sankey Diagram with Main Meter and Submeters
A metering point's place in a submeter hierarchy is defined by its Type of Metering Point property in the metering point details. They are shown in the Hierarchy section on the metering point details page. Refer to Create Submeter Hierarchies for more information.
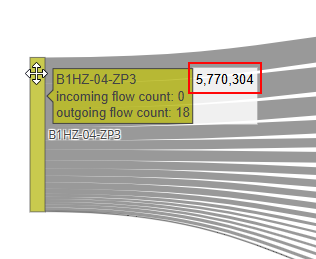
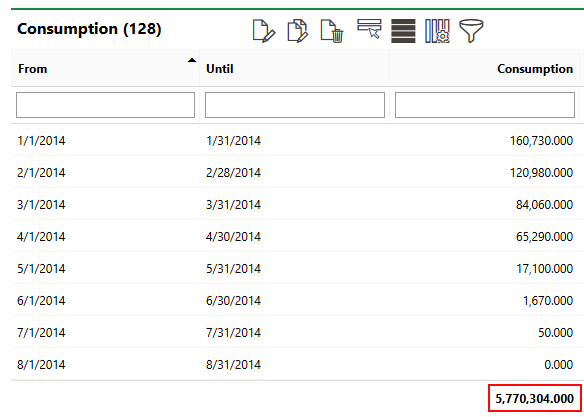
Hover over the main metering point to see its consumption, which reflects the total consumption of the network. You can also see how many submeters are beneath the metering point in the hierarchy (outgoing flow count) and how many are above it (incoming flow count). A main metering point will always have an incoming flow count of zero.
Total Consumption Shown in Sankey Diagram |
Total Consumption Shown on Details Page for Main Metering Point (B1HZ-04-ZP3) |
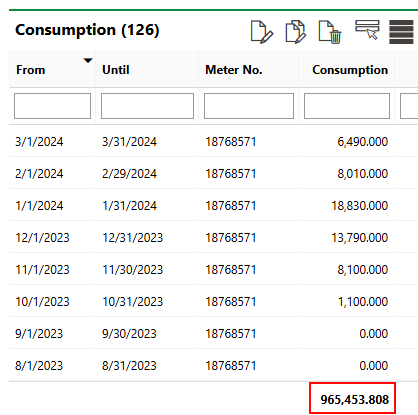
The thickness of the line showing the energy flow between the main metering points and its submeters reflects how much energy is consumed by the submeter. You can see the exact value by hovering over it.
Total Consumption Shown in Sankey Diagram |
Total Consumption Shown on Details Page for Main Metering Point (B1HZ-04-ZP3) |
The thinner lines in the diagram have a proportionately lower consumption.
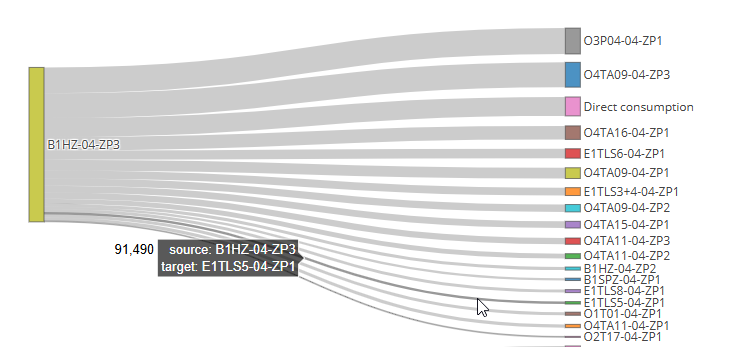
Submeter with Thin Flow Line Showing Lower Consumption
Sankey diagrams can visualize more complex meter networks. The example below shows a metering point with several intermediate metering points (metering points that subordinate to a metering point above them in the hierarchy and superior to submeters below them), which themselves have energy flows to multiple submeters.
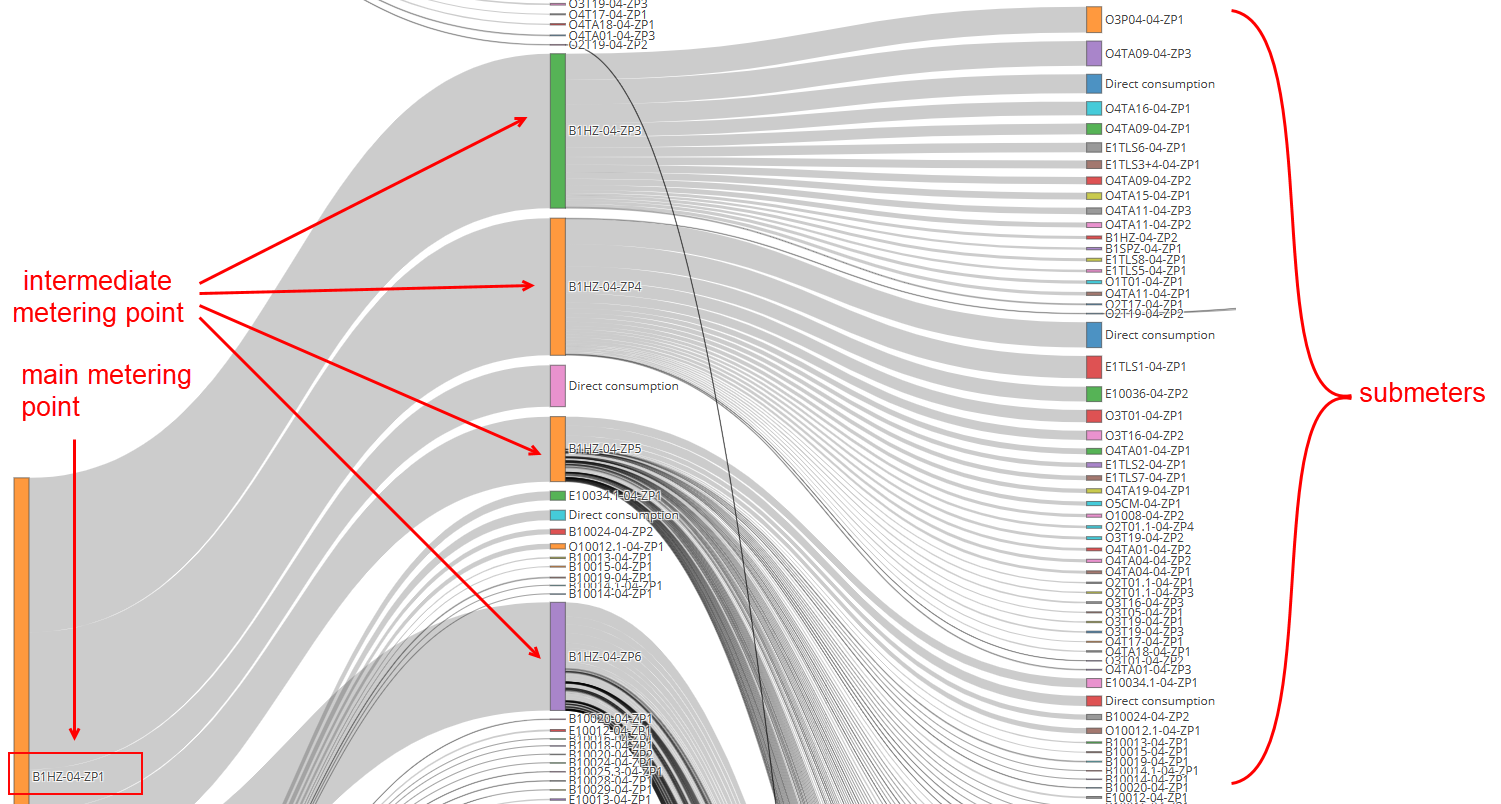
Sankey Diagram Showing Complex Metering Point Network
You can click on a metering point in the diagram and drag it to re-arrange the visualization, if necessary.
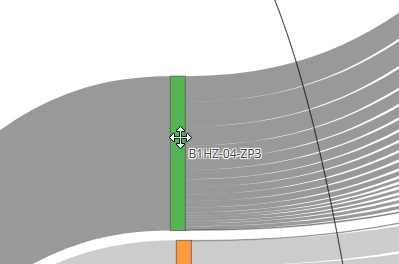
Dragging an Sankey Diagram Object
