The VertiGIS FM Energy dashboard is a landing page that compiles key information items, widgets, and workflow shortcuts for your VertiGIS FM Energy users.
The legacy VertiGIS FM Energy dashboard includes shortcuts to various key workflows in the application as well as widgets that show work items associated with the user signed in. Alternatively, you can create a custom dashboard, which allows you to add KPI counters, charts, web maps, and lists to the dashboard.
You can access the VertiGIS FM Energy dashboard from any page in VertiGIS FM by expanding Energy in the modules panel and clicking Dashboard.
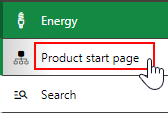
Link to Energy Dashboard
Legacy Dashboard
By default, the VertiGIS FM Energy dashboard is divided into the sections below.
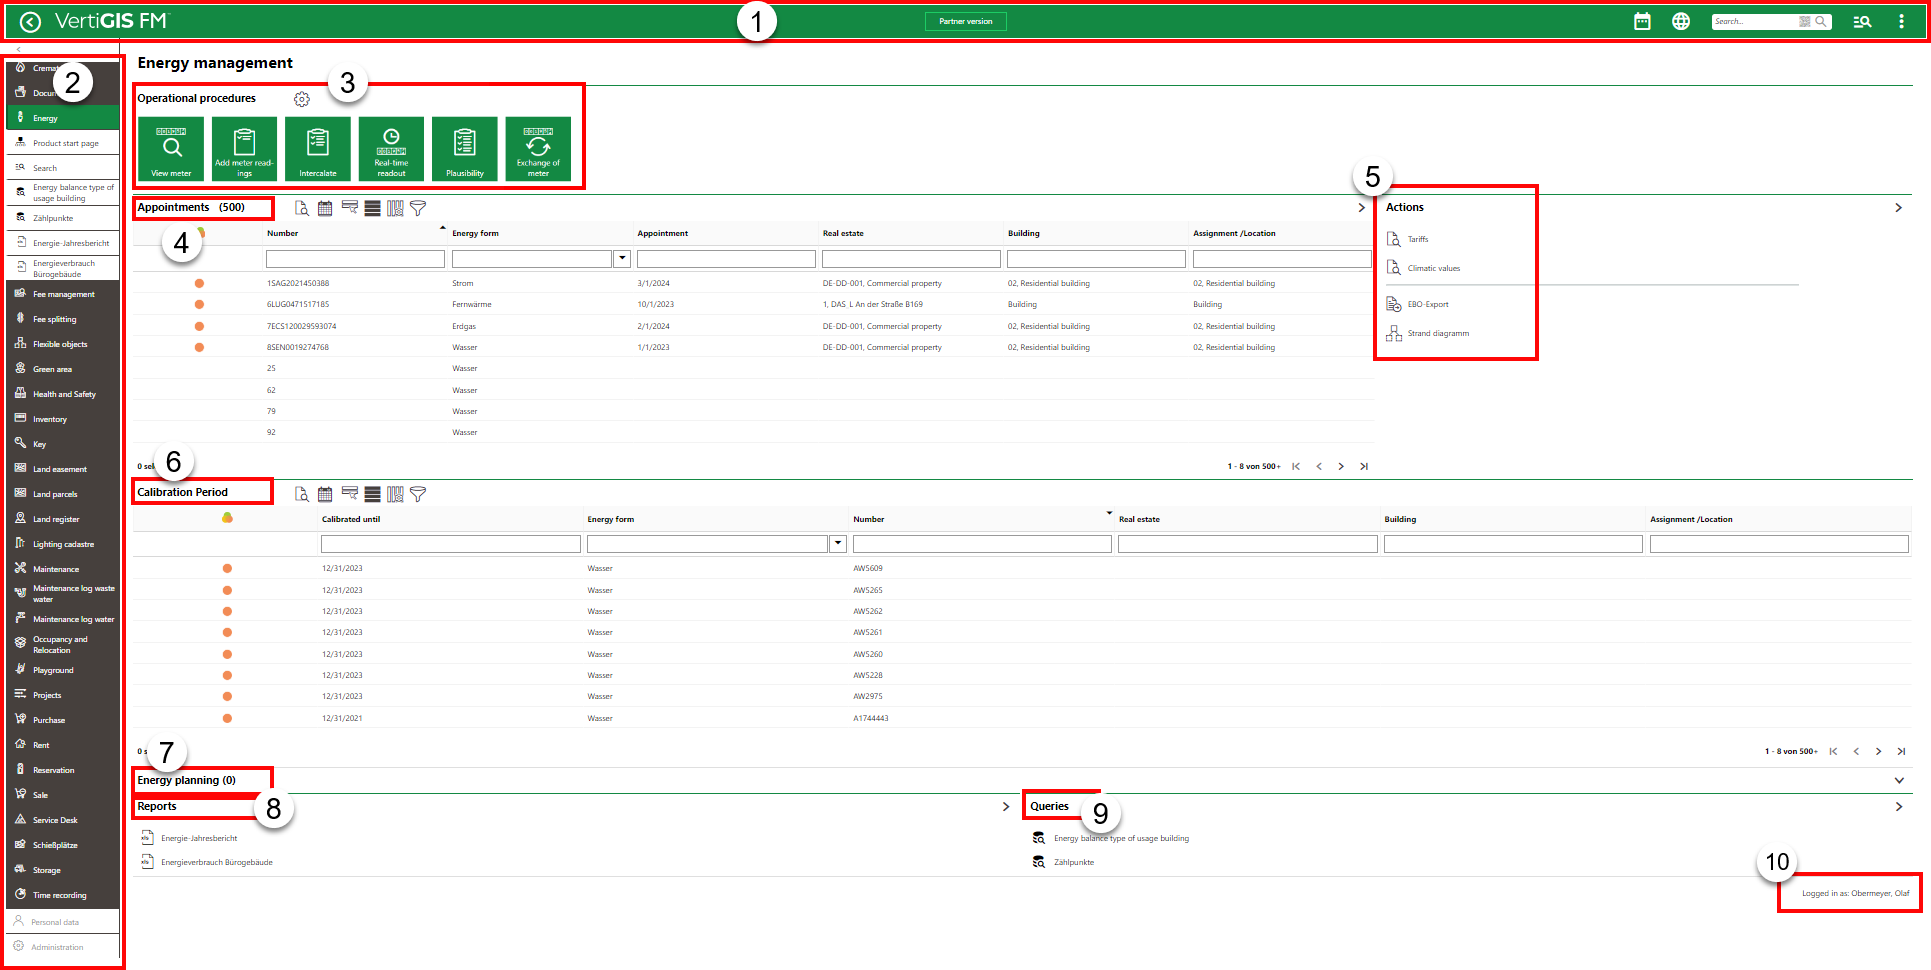
VertiGIS FM Energy Dashboard
Legacy Dashboard Legend
1.Navigation bar: Includes navigation tools available on all VertiGIS FM pages.
2.Modules panel: Lists shortcuts to all modules within the various VertiGIS FM products.
3.Operational Procedures: Provides shortcuts to important workflows within VertiGIS FM Energy
4.Appointments: Lists the appointments (calls or meetings) scheduled for the signed-in user.
5.Actions: Provides links to important tools and workflows within VertiGIS FM Energy.
6.Calibration Period
7.Energy Planning
8.Reports: Links to downloadable reports the system administrator has made available for this page.
9.Queries: Links to search queries the system administrator has made available for this page.
10.User sign in: A string indicating the user signed in to the application.
Navigation Bar
The navigation bar appears on all VertiGIS FM pages. It includes the elements below.
Navigation Bar Elements
Button |
Description |
|
|---|---|---|
|
Return |
Opens to the page you were viewing before you navigated to the current page. |
|
Home |
Opens the VertiGIS FM start page. |
|
Favourites Indicator |
This icon indicates that your user has favourites associated with your profile. When this icon is present, VertiGIS FM limits the instances of data objects you see to the ones you specify on your personal user page. |
|
Object Rights Indicator |
This icon indicates that your user has had object rights assigned by an administrator. When this icon is present, VertiGIS FM limits the instances of data objects you see to the ones the administrator has specified on your user's page. |
|
Fiscal Year |
Opens a drop-down menu from which you can select the fiscal year. |
|
Language |
Opens a drop-down menu from which you can select the language for the application skin. |
|
Search bar |
Allows you to query VertiGIS FM Buildings for any type of data. |
|
Search |
Opens a drop-down menu that allows you to select a data type to search with on a separate page (Maintenance, Device, Component, Ticket, Defect, Orders, Time-recording, Stock-taking, Activity, Appointment, Note, Document). |
|
Vertical ellipsis |
Opens a drop-down menu that allows you access system information and basic functions: Administration, Turn on tablet mode, Web app, Download mobil + MSI, User manual, System information, Legal notes, Log off. |
If the user has both favourites set and object rights assigned, the Favourites Indicator supersedes Object Rights indicator on the navigation bar.
Operational Procedures
The Operational Procedures section of the VertiGIS FM Energy dashboard includes shortcuts to various workflows within the application.
Operational Procedures
|
View Meter•Shortcut to view existing meters used to measure energy consumption. •Opens a page that lists all the existing meters in the VertiGIS FM database.
|
|
Add Meter Readings•Shortcut to add meter readings. •Opens a page that allows you to filter meters by location or energy form. |
|
Intercalate•Shortcut to the Intercalate page. •Opens a page that shows all available intercalate readings (metering points that are missing required readings) and provides a quick workflow to apply estimated readings to their meters. |
|
Real-Time Readout•Shortcut to initiate a Real-Time Readout, which means to request the current value on a sensor. •Opens a page on which you select a reading reason and the meter for whose sensor you want to retrieve the current value. |
|
Plausibility•Links to the Plausibility page. •Opens a page on which you can manage tolerances (expected energy consumption at your metering points) and conduct plausibility checks. This involves checking variances and missing assignments. |
|
Exchange of Meter•Shortcut to the workflow to exchange a meter. •Opens a page on which you select the meter you want to unassign from its metering point. On the next screen, you can select another meter that you want to replace the unassigned meter. |
|
Energy Report•Stores resources used to analyze energy consumption across your network. •Generate consumption charts and tables, Sankey diagrams, and heatmaps based on energy consumption recorded at your metering points. |
Appointments
The Appointments section lists the appointments (a call or in-person meeting) scheduled for the user signed in to the application. For an appointment to display in the Appointments section on the start page, the user signed in to VertiGIS FM must be indicated in the Employees field of the appointment form.

Appointments Section on the VertiGIS FM Maintenance Start Page
Appointments are events that can be scheduled for most data objects in VertiGIS FM and are not to be confused with orders. Because an appointment must be associated with an object (for example, a meter), you must create it on the details page for an object. You cannot create them on the search page, like you can for other event-based objects.
In VertiGIS FM Energy, the system generates appointments for items like upcoming or overdue meter readings based on the Reading Interval defined in the metering point details for the metering point to which the meter is assigned. These appointments do not have a Type property or a details page, and double-clicking them takes you to the details page for the meter with the required reading.
In the Appointments table, upcoming required meter readings are represented by the  symbol, and overdue readings are represented by the
  symbol.

Upcoming and Overdue Meter Readings in the Appointments Section on the VertiGIS FM Energy Start Page (April 30, 2024)
Actions
The Actions section lists links to the following VertiGIS FM Energy tools and resources:
•Tariffs: Links to the Tariffs page, on which you can create and manage tariffs that, when applied to your metering points, calculate the financial costs of your organization's energy consumption.
•Climatic Values: This feature allows you to apply climatic values to your energy consumption so that the data you analyze is adjusted for the weather in your region. Currently, this feature is only available for customers in Germany. English-language documentation will be available when an interface that can gather global weather stations is released.
•EBO-Export: Documentation on this feature will be available in the future.
•Strand Diagram: Links to the strand diagram page, which provides a visual representation of all metering points hierarchies (and their associated meters) in VertiGIS FM Energy.
Reports
The Reports section lists download links for the reports the system administrator has made available on this page for the role your user has been assigned. Clicking the link generates the report. Refer to the Report and Query Permissions administration topic for more information.
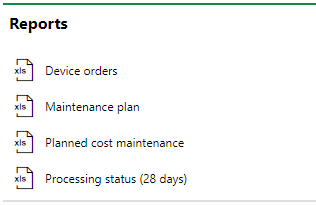
Reports Section
You can generate reports using other data on the search page. Refer to Generate Reports for more information.
Queries
The Queries section lists links to the search queries the system administrator has made available on this page for the role your user has been assigned. Refer to the Report and Query Permissions for more information.
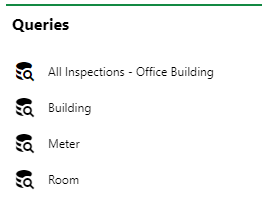
Queries Section
Refer to Save a Query for instructions on how to create a query.
Dashboard Customization
As a system administrator, you can create a customized dashboard for the start page for each VertiGIS FM product and module included in your license. Tools in the dashboard customization feature allow you to design a dashboard that conveys important information to your users, using your own live VertiGIS FM data associated with any assets, data objects, and properties in your system.
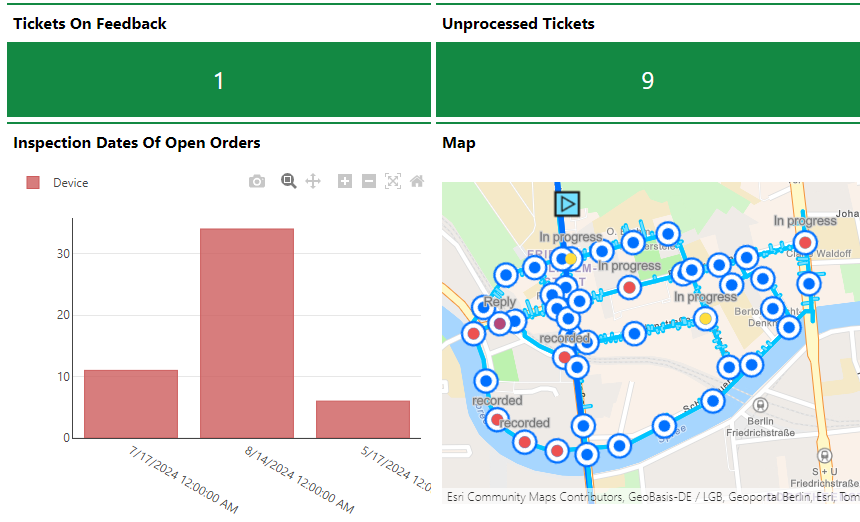
Customized Dashboard with Characteristic Values, Charts, and a Map
Dashboard objects you can add to your start page include KPI metrics, charts, lists, and maps. You can also include any of the template sections shown on the default start page to your customized dashboard.
When you create a custom dashboard, you can add any of the items below to your start page.
Dashboard Object Presentation Types
Presentation Type |
Description |
|---|---|
A counter that reflects the quantity of a data object (e.g., the number of buildings or devices) in the VertiGIS FM database, or the sum or average of a property with a numeric values across all data objects of a given type (e.g., the total floor area across all buildings in the system). |
|
A line, bar, or circle (pie) chart that visualizes data associated with a VertiGIS FM data object. |
|
A list of data objects of a given type (e.g., devices, buildings, or work orders), with their properties sorted into columns to allow your users to search and filter them on the dashboard. |
|
A VertiGIS Studio web map that has been integrated with your VertiGIS FM environment. You can configure it to display a layer mapped to a data object in VertiGIS FM. |
|
An icon image and text that links to an external application or website. |
|
Default data objects, like Actions, Operational Procedures, and task-based objects associated with the user signed in to VertiGIS FM. |
To access the dashboard customization page, click the gear icon (![]() ) at the top of the start page whose dashboard you want to customize.
) at the top of the start page whose dashboard you want to customize.
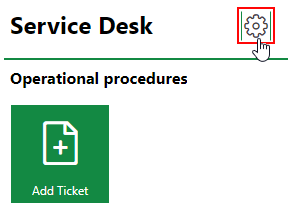
Link to Dashboard Customization Page
Refer to Dashboard Customization for instructions on how to add custom objects to your dashboard.


