The VertiGIS FM Costs and Budget module allows you to manage budgets, invoices, ledger accounts, and other financial details associated with the facilities you manage. The module is intended to be used by managers whose roles include entering and documenting the finances associated with their facilities' management.
With Costs and Budget, you can
•create the ledger accounts, cost centers, cost types, and cost objects to document and monitor the costs associated with your facilities' finances.
•set annual budgets for each account and cost center in the system, and monitor their remaining budgets.
•create invoices that can be associated with any data object in VertiGIS FM and be sent to any account or cost center in the system.
•process invoices, which subtract amounts from or add amounts to their account's or cost center's remaining annual budgets
•set up allocation accounts, which allow you to allocate invoices sent to a cost center to other cost centers based on a facility's area or usage.
•generate XML or CSV files to export invoice data to an external financial management system.
You can access the Costs and Budget module by expanding Costs and Budget in the modules panel and clicking Dashboard.
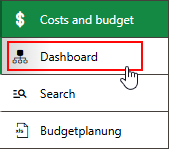
Costs and Budget in Modules Panel
Legacy Dashboard
The Costs and Budget dashboard is divided into the sections below.
Budget Controlling
The Budget Controlling section lists the accounts and cost centers whose remaining budgets have reached their warning thresholds for the fiscal year set in your VertiGIS FM application. A warning threshold is a percentage of an account's or cost center's budget. When an account's or cost center's remaining budget falls below a percentage of its annual budget that you specify, the account or cost center appears in the Budget Controlling section for closer monitoring.

Budget Controlling on Costs and Budget Dashboard
An account's or a cost center's remaining budget increases or decreases as invoices that have the account or cost center selected in the corresponding fields are checked or printed.
Account and Cost Center Status
Icon |
Description |
|---|---|
|
The account's or cost center's remaining budget is below the warning threshold level. |
|
The budget has been spent entirely, and the remaining budget for the account or cost center is 0.00. |
Refer to Set Budgets for more information.
Actions
The Actions section lists shortcuts to tools and resources used in common Costs and Budget workflows.
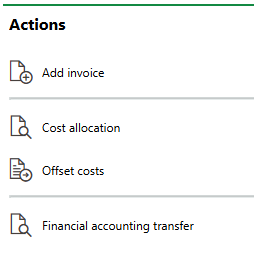
Costs and Budget Actions
These shortcuts include the following:
•Add invoice: Create a new invoice.
•Cost allocation: Opens the page to set up allocation accounts and criteria. This feature allows you to allocate costs sent to a specific cost center to other cost centers based on facilities' usage or area.
•Offset costs: Opens a page that shows the possible cost allocations for each month. On this page, you can confirm that costs sent to a cost center and ledger account in the allocation account should be allocated among the other specified cost centers.
•Financial accounting transfer: Export a file with payment and invoice information associated with contracts managed in VertiGIS FM Contracts. The file can then be imported into your organization's financial management or accounting system for processing.
Reports
The Reports section lists download links for the reports the system administrator has made available on this page for the role your user has been assigned. Clicking the link generates the report. Refer to the Report and Query Permissions administration topic for more information.
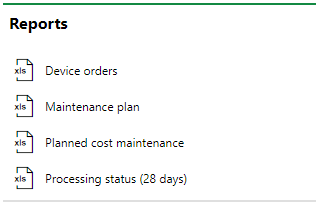
Reports Section
You can generate reports using other data on the search page. Refer to Generate Reports for more information.
Queries
The Queries section lists links to the search queries the system administrator has made available on this page for the role your user has been assigned. Refer to the Report and Query Permissions for more information.
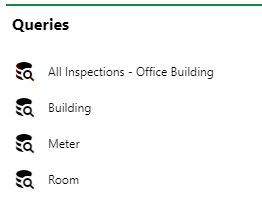
Queries Section
Refer to Save a Query for instructions on how to create a query.
Dashboard Customization
As a system administrator, you can create a customized dashboard for the start page for each VertiGIS FM product and module included in your license. Tools in the dashboard customization feature allow you to design a dashboard that conveys important information to your users, using your own live VertiGIS FM data associated with any assets, data objects, and properties in your system.
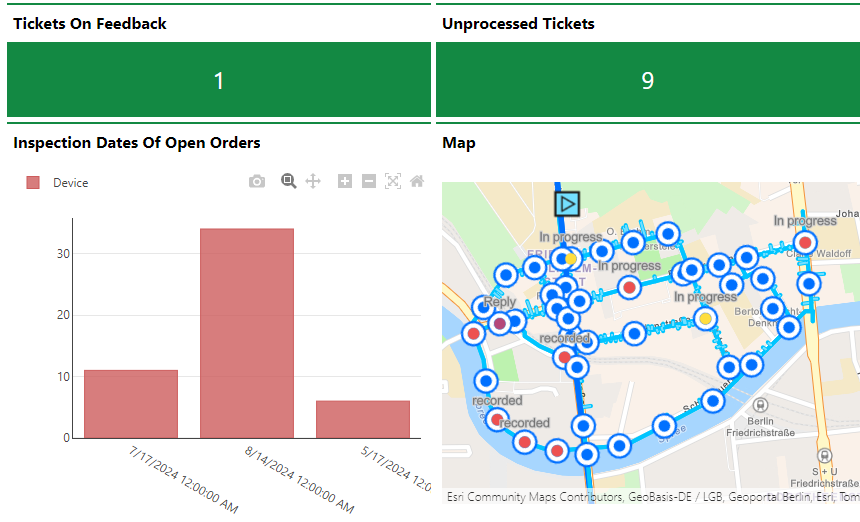
Customized Dashboard with Characteristic Values, Charts, and a Map
Dashboard objects you can add to your start page include KPI metrics, charts, lists, and maps. You can also include any of the template sections shown on the default start page to your customized dashboard.
When you create a custom dashboard, you can add any of the items below to your start page.
Dashboard Object Presentation Types
Presentation Type |
Description |
|---|---|
A counter that reflects the quantity of a data object (e.g., the number of buildings or devices) in the VertiGIS FM database, or the sum or average of a property with a numeric values across all data objects of a given type (e.g., the total floor area across all buildings in the system). |
|
A line, bar, or circle (pie) chart that visualizes data associated with a VertiGIS FM data object. |
|
A list of data objects of a given type (e.g., devices, buildings, or work orders), with their properties sorted into columns to allow your users to search and filter them on the dashboard. |
|
A VertiGIS Studio web map that has been integrated with your VertiGIS FM environment. You can configure it to display a layer mapped to a data object in VertiGIS FM. |
|
An icon image and text that links to an external application or website. |
|
Default data objects, like Actions, Operational Procedures, and task-based objects associated with the user signed in to VertiGIS FM. |
To access the dashboard customization page, click the gear icon (![]() ) at the top of the start page whose dashboard you want to customize.
) at the top of the start page whose dashboard you want to customize.
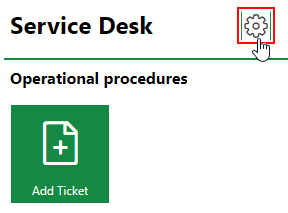
Link to Dashboard Customization Page
Refer to Dashboard Customization for instructions on how to add custom objects to your dashboard.

