The Energy Balance page displays charts you can use to analyze the service area's consumption of energy forms over different time periods.
Energy Balance Page
You can access the Energy Balance page by clicking the Energy Balance (![]() ) icon on the service area details page.
) icon on the service area details page.
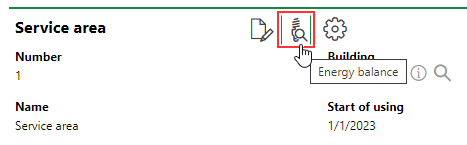
Energy Balance Icon on Service Area Details Page
The Energy Balance (![]() ) icon is not visible unless you assign metering points to the service area. Refer to Assign Metering Points to a Service Area for instructions.
) icon is not visible unless you assign metering points to the service area. Refer to Assign Metering Points to a Service Area for instructions.
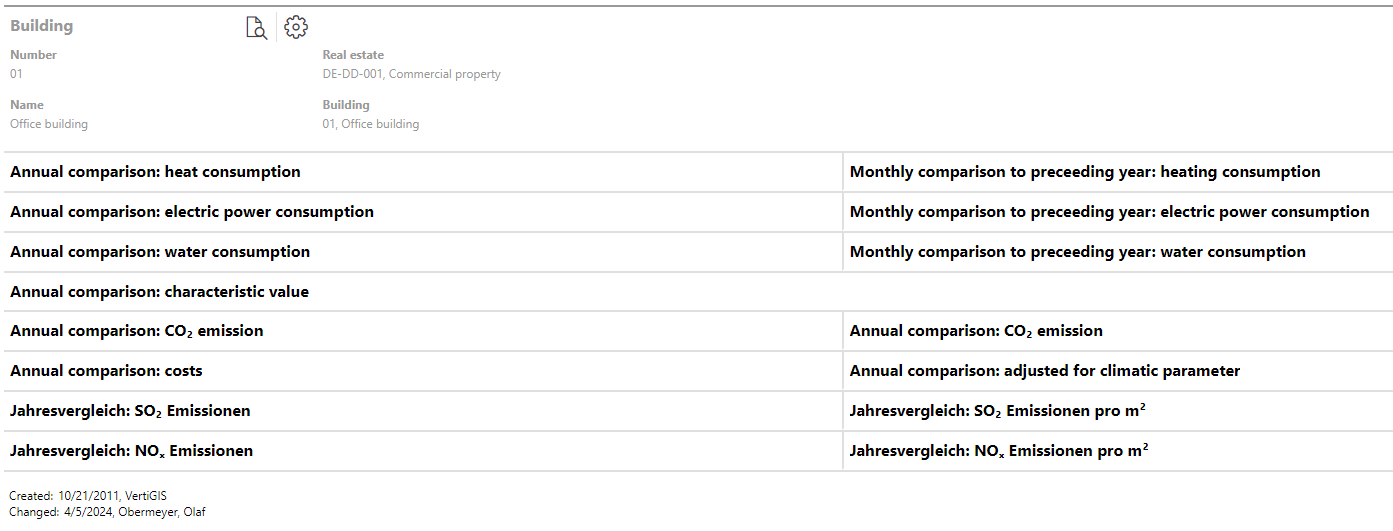
Charts and Graphs
You can see the service area's energy consumption for the following graphs.
•Annual comparison: heat consumption
•Monthly comparison to preceeding year: heating consumption
•Annual comparison: electric power consumption
•Monthly comparison to preceeding year: electric power consumption
•Annual comparison: water consumption
•Monthly comparison to preceeding year: water consumption
•Annual comparison: characteristic value
•Annual comparison: CO₂ emission
•Annual comparison: costs
•Annual comparison: adjusted for climatic parameter
The energy consumption shown in most of these graphs is specific to the Energy Form property of the metering points associated with the service area and uses the units of measurement defined in the energy form.
Some charts (for example, annual costs) allow you to compare the costs associated with your consumption of various energy forms. These charts require tariffs or pricing information in the consumption entries so that the system can calculate the costs of the service area's energy consumption.
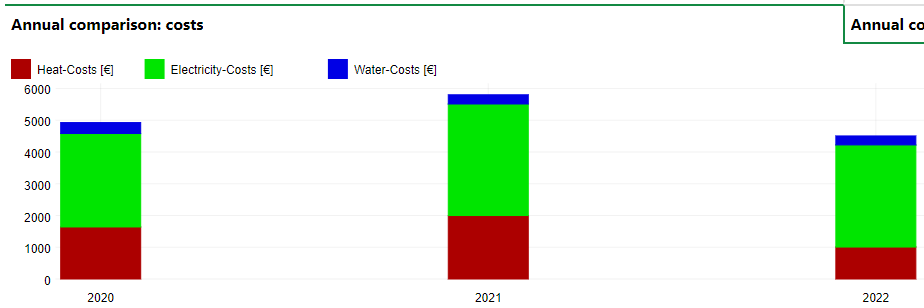
Annual Comparison: Costs
Target Values and Thresholds
You can display target values (desired energy consumption levels) and thresholds (consumption levels above which the service area's energy usage should never surpass) on the charts available on the Energy Balance page. The graphs visualize these levels against the service area's actual energy consumption.
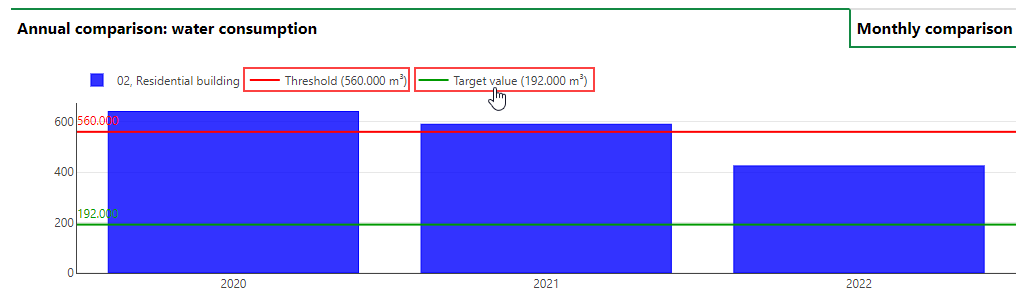
Energy Balance Graph with Threshold and Target Value
You can hide the target values or threshold by clicking their buttons in the legend at the top of the graph.
For service areas, the target and threshold values are set in the Target Values and Limits section on the service area details page. To set the target and threshold values for the service area, click the Edit (![]() ) icon.
) icon.
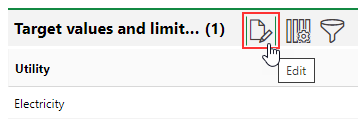
Target Values and Limits Section
You can define individual sets of target values and thresholds for each Utility used in the service area. They are entered per m² of the net area of the buildings in the service area.
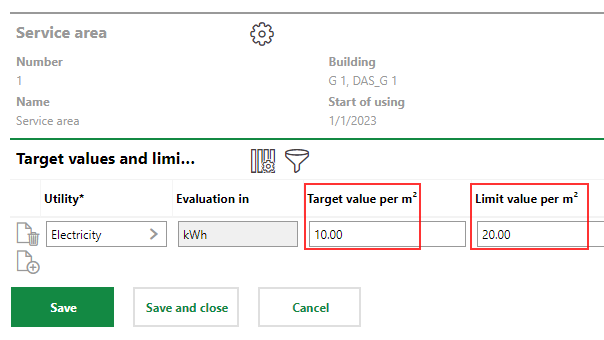
Target Values and Limits
The service area whose values are shown in the example above is assigned to a building whose Net Area is 200 m². This means its target value is 2,000 (10 × 200) and its limit value (threshold) is 4,000 (20 × 200) in the corresponding Energy Balance graphs for that utility.
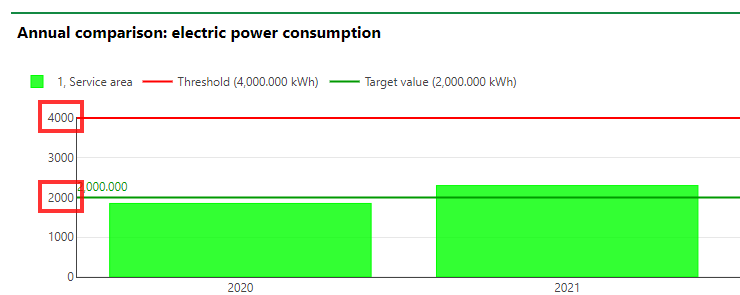
Target Value and Limits Shown in Energy Balance Graph