The Energy Balance page displays charts you can use to analyze the building's consumption of energy forms over different time periods.
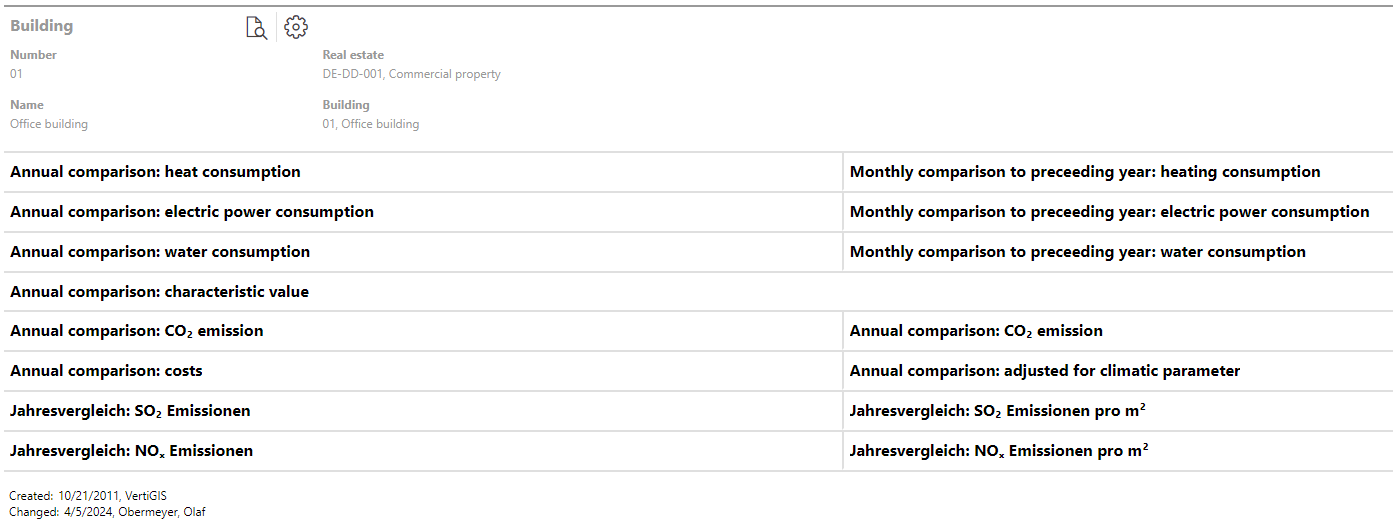
Energy Balance Page
You can access the Energy Balance page by clicking the Energy Balance (![]() ) icon on the building details page.
) icon on the building details page.
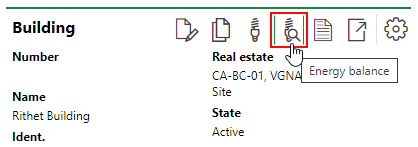
Energy Balance Icon on the Building Details Page
You can only access the Energy Balance page for a building if your VertiGIS FM implementation includes a license for VertiGIS FM Energy. If this page is empty, you must assign metering points to the building so that readings on the metering points' assigned meters are tabulated as the building's energy consumption.
Assign Metering Points to a Building
To assign a metering point to a building, select the building (or a location within the building) as the Installation Location in the metering point details. Select the building's real estate or the building itself in the Assignment/Location field.
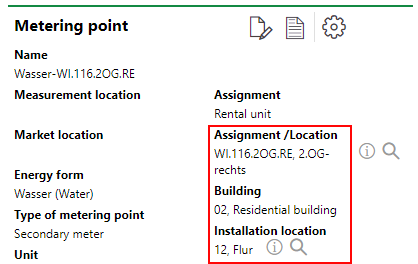
Metering Point Building Assignment
Charts and Graphs
You can see the building's energy consumption for the following graphs.
•Annual comparison: heat consumption
•Monthly comparison to preceeding year: heating consumption
•Annual comparison: electric power consumption
•Monthly comparison to preceeding year: electric power consumption
•Annual comparison: water consumption
•Monthly comparison to preceeding year: water consumption
•Annual comparison: characteristic value
•Annual comparison: CO₂ emission
•Annual comparison: costs
•Annual comparison: adjusted for climatic parameter
The energy consumption shown in most of these graphs is specific to the Energy Form property of the metering points associated with the building and uses the units of measurement defined in the energy form.
Some charts (for example, annual costs) allow you to compare the costs associated with your consumption of various energy forms. These charts require tariffs or pricing information in the consumption entries so that the system can calculate the costs of the building's energy consumption.
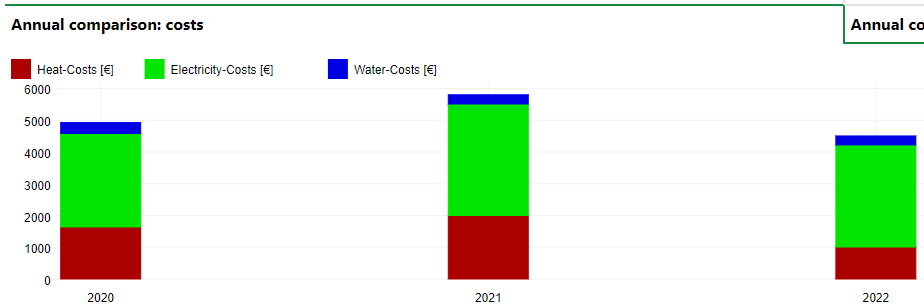
Annual Comparison: Costs
Target Values and Thresholds
You can display target values (desired energy consumption levels) and thresholds (consumption levels above which the building's energy usage should never surpass) on the charts available on the Energy Balance page. The graphs visualize these levels against the building's actual energy consumption.
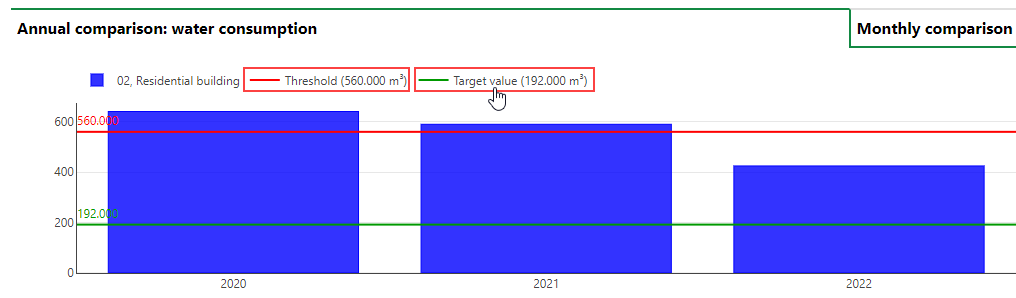
Energy Balance Graph with Threshold and Target Value
You can hide the target values or threshold by clicking their buttons in the legend at the top of the graph.
For buildings, target values and thresholds are set in the Building Management Usage (Usage.xls) import file, which you can download on the Administration > Interfaces > Import page.
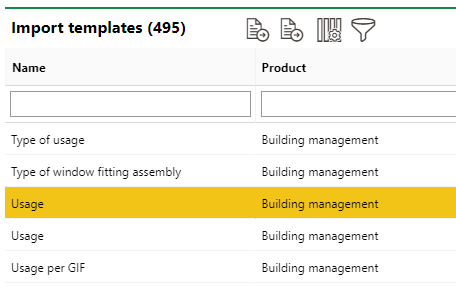
File for Importing Target Values and Thresholds
You can then enter the target values and threshold values in the corresponding cells in the rows whose buildings you want to set the values for.
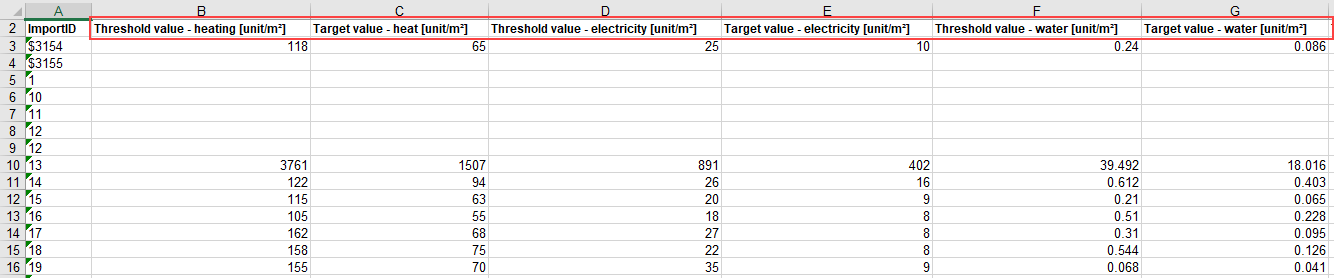
Excel File for Target Values and Thresholds
When you have entered the intended values, you can import the file into VertiGIS FM. Refer to Import for more information.
Contact support for assistance importing target values and thresholds.