The Energy Controlling tool allows you to see data captured by the building's energy sensors in graphs. You can access these graphs in two places:
•in the Energy Controlling section on the sensor details page.
•if your VertiGIS FM license includes VertiGIS FM Buildings, by clicking the Energy Sensors (![]() ) icon on the building details page.
) icon on the building details page.
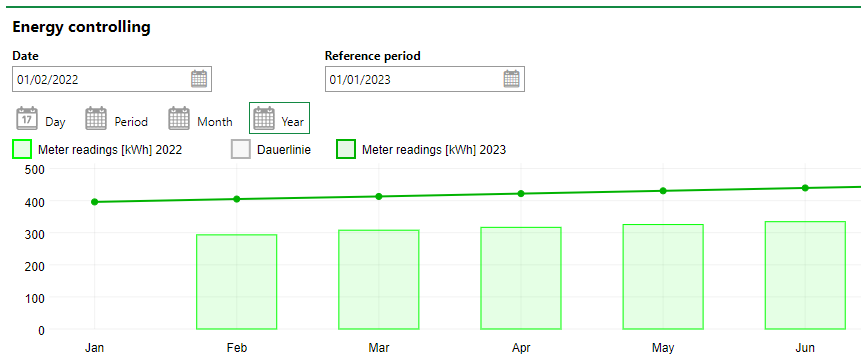
Energy Controlling Annual Diagram
You can manage the data shown in the chart using the buttons and controls outlined in the table below.
Energy Controlling Controls
Element |
Description |
|---|---|
Date |
The date, month, and year whose sensor value data you want to see in the chart. |
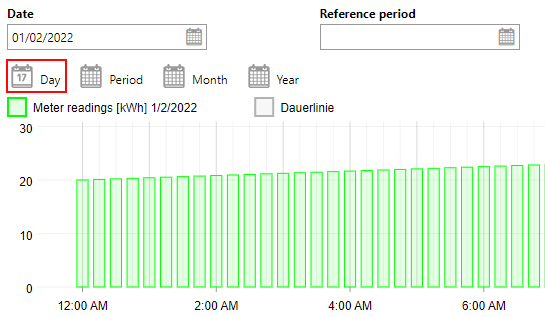
Day |
When clicked, shows the sensor values chronologically (by the time of day) for the day selected in the Date field.
Sensor Values by Time of the Day |
Period |
|
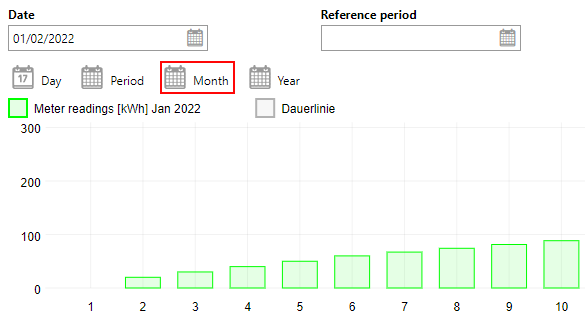
Month |
When clicked, shows the sensor values chronologically (by days of the month) for the month selected in the Date field.
Sensor Values by Days of the Month |
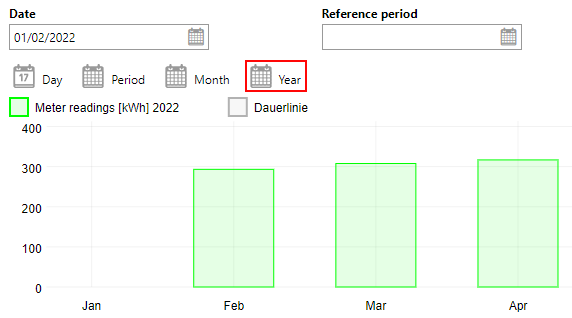
Year |
When clicked, shows the sensor values chronologically (by months of the year) for the year selected in the Date field.
Sensor Values by Months of the Year |
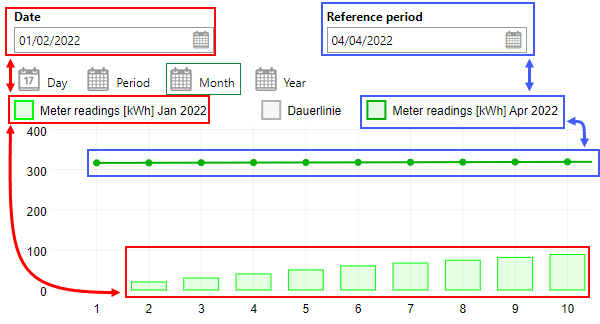
Meter Readings (Date) |
When clicked, shows or hides the data for the day, month, or year selected in the Date field.
Date vs Reference Period |
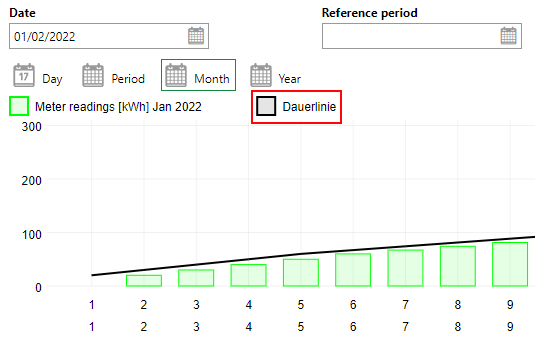
Duration line |
When clicked, shows or hides a line connecting incrementing sensor values in the chart.
Sensor Value Duration Line |
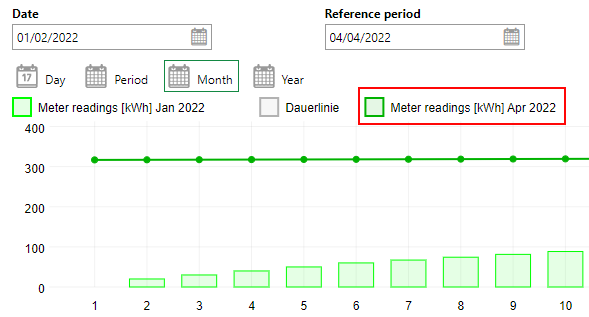
Reference Period |
A date, month, and year you against which you want to compare the date, month, and year you selected in the Date field. This feature is used to compare the data from the time selected in the Date field with the data from another time period. For example, you may compare the sensor values for January 2022 and January 2023. |
Meter Readings (Reference Period) |
When clicked, turns on or off the data for the day, month, or year selected in the Reference Period field.
Reference Period |
Data for meter reading values not recorded by the sensor are not included in the Energy Controlling diagrams on the sensor details page.
The Energy Controlling graphs do not appear on the building's Energy Controlling page if all of the sensors listed in the Sensors section have the Evaluation of Building check box unchecked in the sensor details.
Sensors
The Sensors section beneath the Energy Controlling graph lists the sensors assigned to the building.
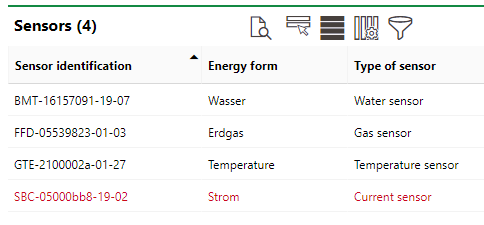
Sensors Section
If a sensor in the table is red, its Discarded property has been set to Yes. You can edit the sensor details to reactivate the sensor.
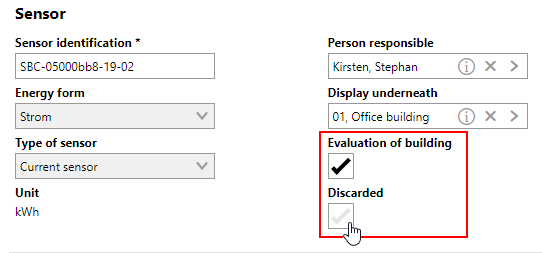
Evaluation of Building and Discarded Check Boxes in Sensor Details
Building Details Page
If your license includes VertiGIS FM Buildings, you can also access the Energy Controlling graphs on the building details page for the building selected in the Display Underneath field in the sensor details.
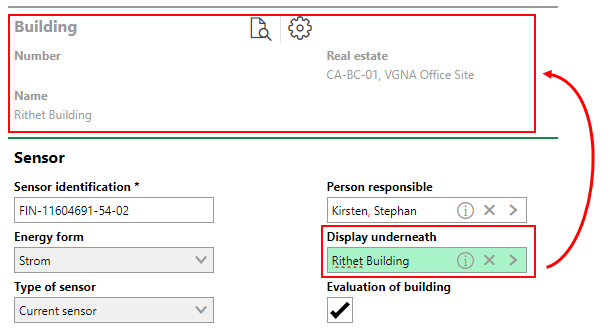
Building Associated with Sensor
To access the Energy Controlling graphs from the building details page, click the ![]() icon.
icon.
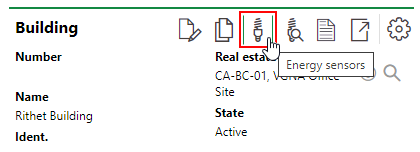
Energy Sensors Icon on the Building Details Page
If the building has multiple sensors for different type of sensors and energy forms assigned to it, you can toggle between them by clicking the icons for the various energy forms.
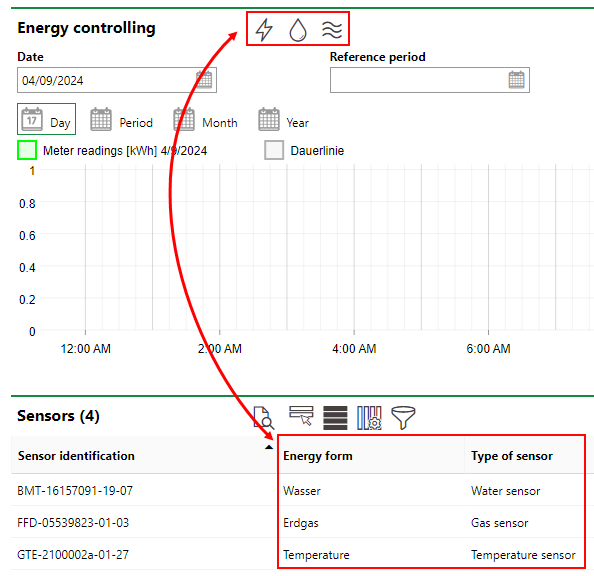
Energy Form Sensor Toggle for Energy Controlling Graphs
Links to energy sensors managed in VertiGIS FM Energy can only be established on the building details page. For example, if you select a real estate in the Display Underneath field in the building details, no linking icons appear on the real estate details page.