Gantt charts provide a visual representation of your project's schedule. VertiGIS FM generates a Gantt chart for each project in your database.
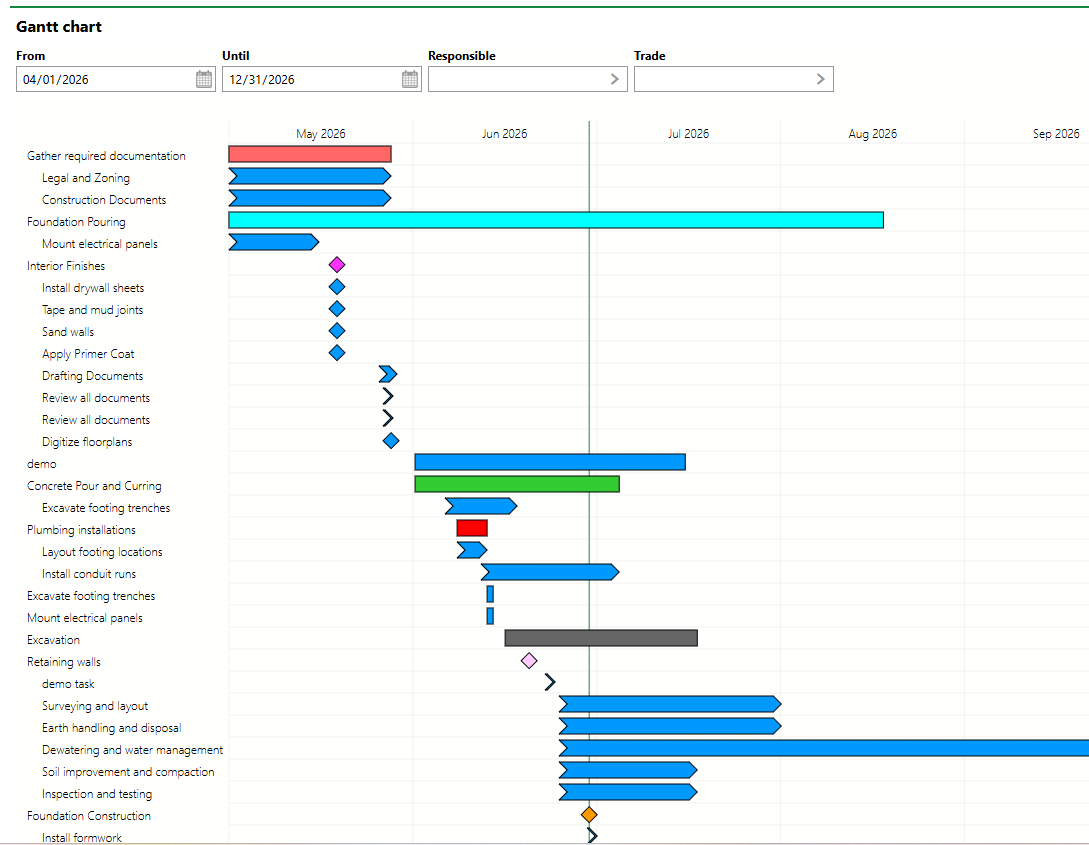
Sample Gantt Chart
To see your project's Gantt chart with data, the project must have
•a From date and Until date in the project properties.
•project orders with associated dates.
To see your project's Gantt chart, click the Gantt Chart (![]() ) icon at the top of the project details page.
) icon at the top of the project details page.
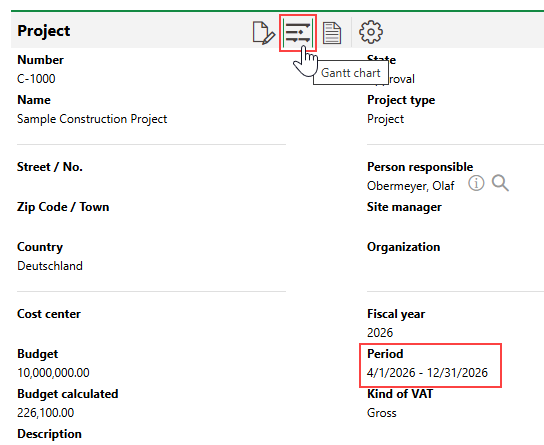
Accessing Project Gantt Chart
Overview
Refer to the sections below for help understanding the Gantt chart.
Orders and Tasks
The Gantt chart's y-axis lists the scheduled orders and tasks in your project, while the x-axis represents time across the duration of your project. Items on the y-axis that are flush with the left margin are orders, and indented items are tasks.
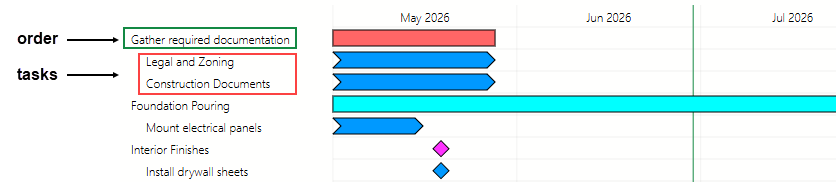
Orders and Tasks on Y-Axis
Tasks are not necessarily child elements of the order above them on the y-axis. Orders and tasks are listed chronologically according to their start and completion dates.
Tasks not associated with an order (tasks added in the Tasks section on the project's details page) are not indented.
Visual Elements
Image |
Representation |
|---|---|
|
The image represents the schedule for an order that is associated with From and Until dates. |
|
The image represents the schedule for a task that is associated with From and Until dates. |
|
The image represents the date for an order or task that is associated with a milestone. |
|
|


Colour
The colour in which an order or task appears on the Gantt chart is determine by the Colour property in its order. You can change the item's colour on the Gantt chart by editing the order. Tasks do not have their own colour property and appear in the Gantt chart in the same colour assigned to their parent order.
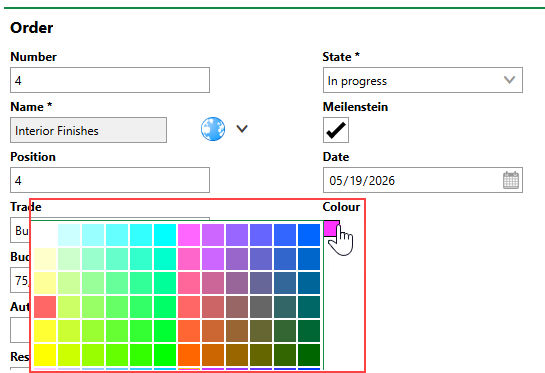
Editing Colour Associated with Order or Task
Filters
Use the filters above the Gantt chart to filter data shown in the chart.
From and Until
Using the date pickers in the From and Until menus above the Gantt chart, you can change the time represented on the x-axis. VertiGIS FM reloads the Gantt chart as soon as you select a new date, showing only orders and tasks scheduled for the period between the From and Until dates. In the example below, data is filtered to show only orders and tasks scheduled through the end of June for a project scheduled to run until the end of the year.
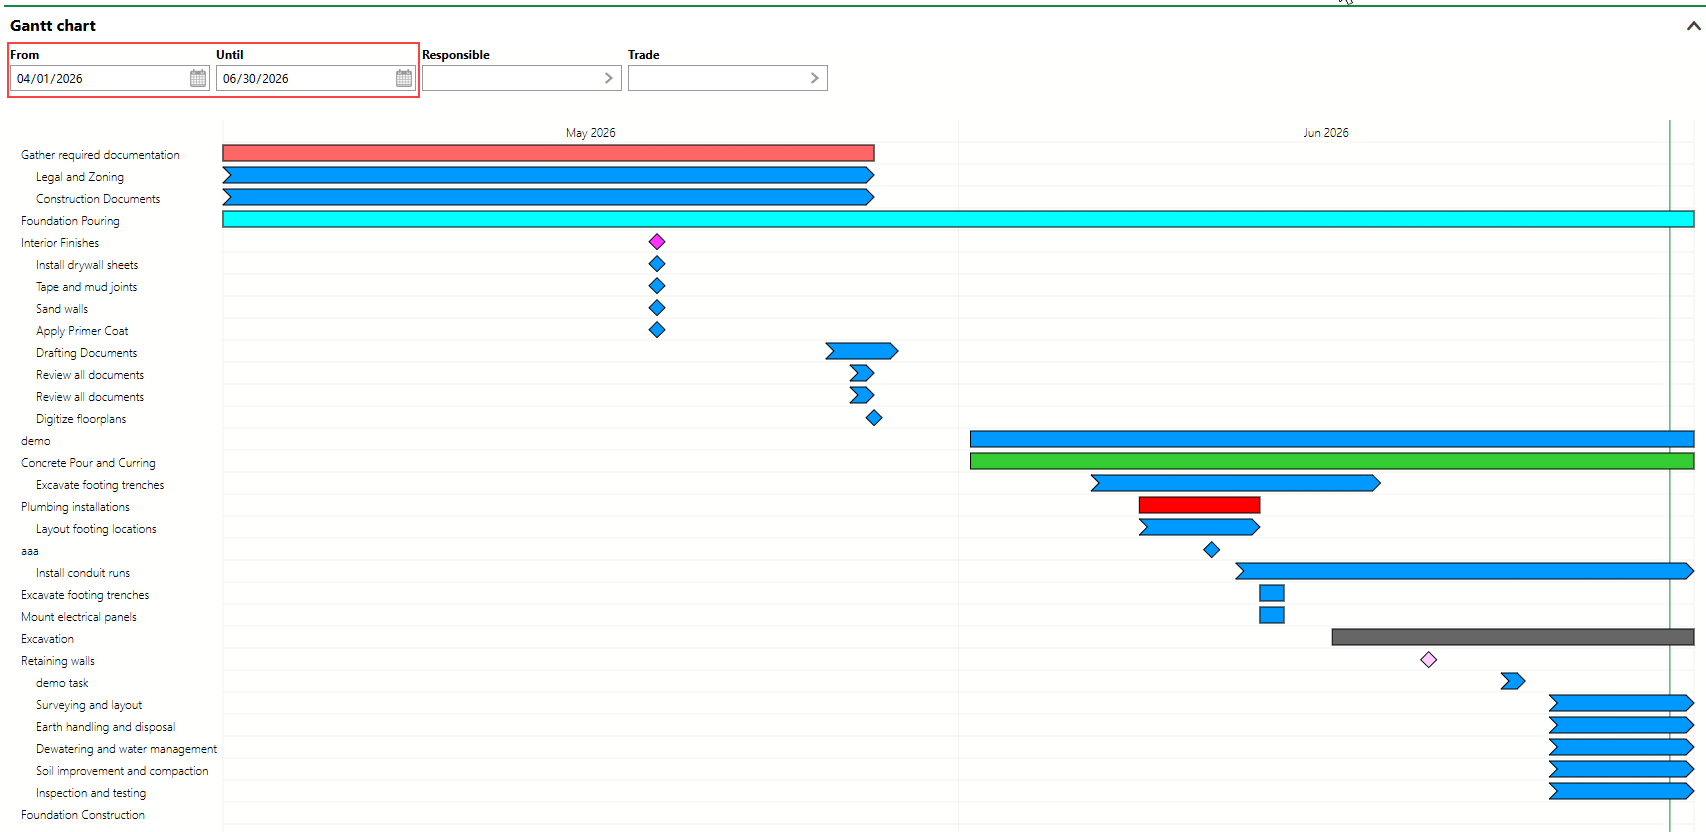
Gantt Chart Filtered Using Schedule Dates
Responsible
Using the Responsible menu, you can filter data in the Gantt chart to only show orders and tasks assigned to the selected contact.
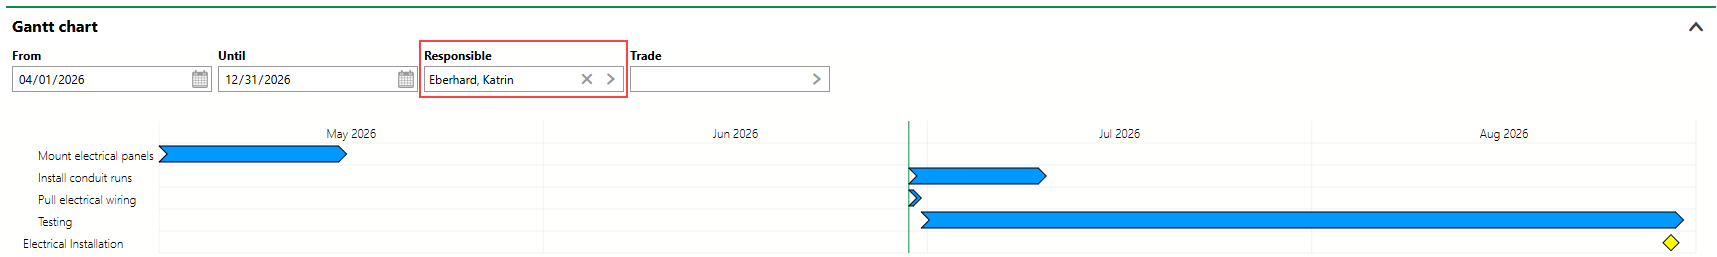
Gantt Chart Filtered for Person Assigned
You can select any employee or contact stored in VertiGIS FM in this menu.
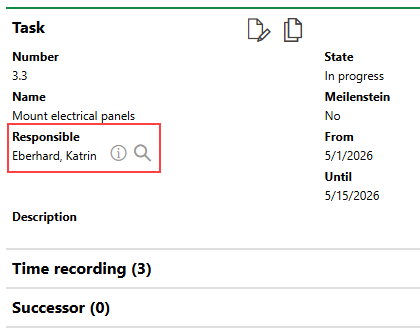
Task Assignment
Trade
Using the Trade menu, you can filter data in the Gantt chart to only show orders associated with the selected trade, as well as child tasks of these orders.
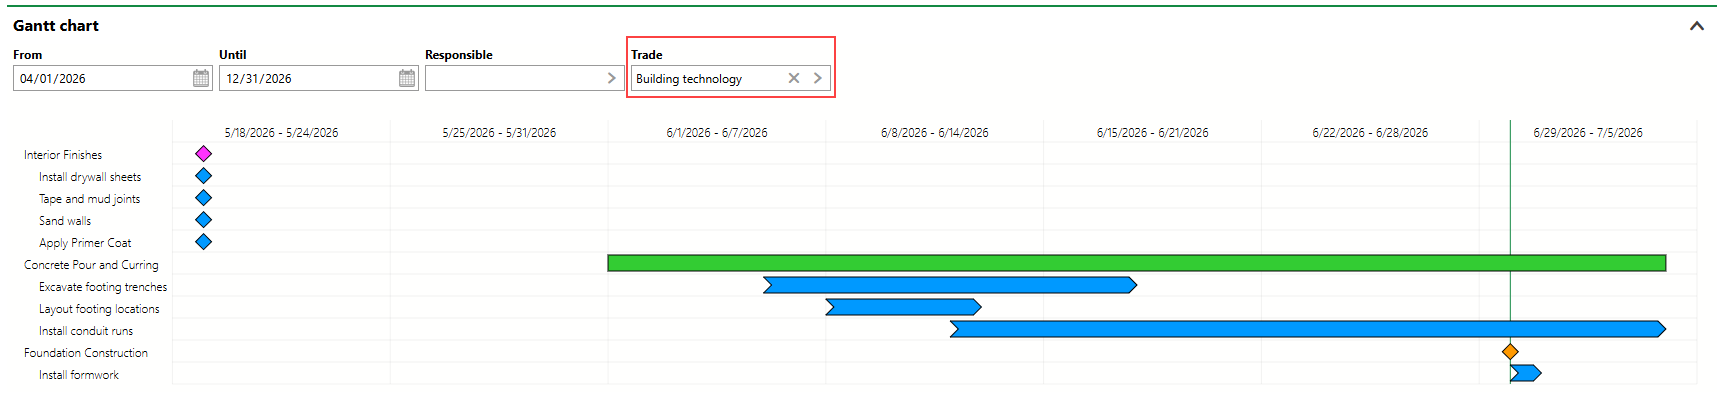
Gantt Chart Data Filtered by Trade
Trades are saved in the Trade catalog and associated with orders in the Trade menu in the order's details.
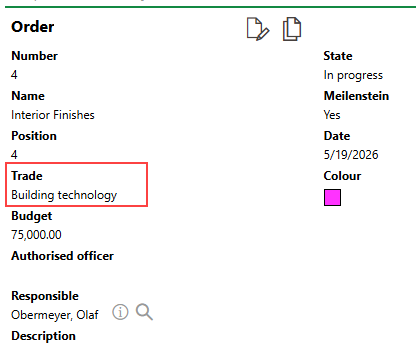
Order Trade Menu
Individual tasks are not associated with their own trade. Tasks appear on the Gantt chart when their parent order's Trade property is selected in the Trade filter menu.