A characteristic value dashboard object is a basic counter that reflects the quantity of a data object in the VertiGIS FM database (for example, the number of buildings or devices) or the sum or average of an object's property that has a numeric value (for example, the average floor area of rooms in the customer database). This type of dashboard object is helpful for displaying KPI metrics in a place your users will see them.
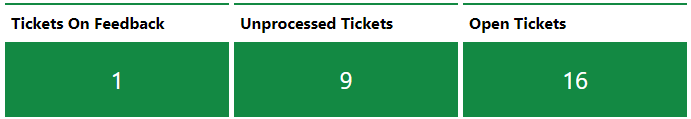
Three Characteristic Value Objects
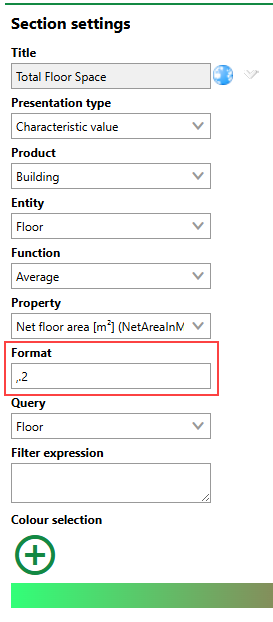
The following inputs are required or optional when creating a Characteristic Value dashboard object.
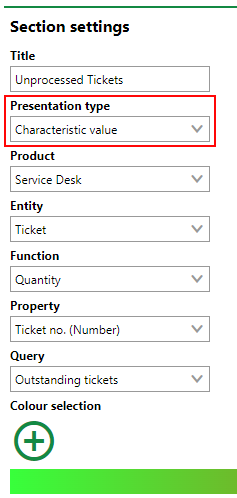
Section Settings for Characteristic Value
Characteristic Value Dashboard Object Inputs
Setting |
Description |
||||||
|---|---|---|---|---|---|---|---|
Product |
The VertiGIS FM product associated with the data object whose data you want to capture in the characteristic value. |
||||||
Entity |
The data object (e.g., buildings, devices, or service desk tickets) whose data you want to show in the characteristic value. |
||||||
Function |
How the characteristic value will show the data for the Entity and Property you've selected.
To leave the Function field blank, click in the menu and select the blank option at the top of the list. If you do not select any option from the menu, VertiGIS FM will prevent you from saving the dashboard object. |
||||||
Property |
The property of the object selected in the Entity menu whose data you want to show in the characteristic value. You do not have to select a property if you select Quantity in the Function menu. |
||||||
Format |
A field in which you can enter controls that determine how numbers associated with specified data appear on the dashboard counter, including •the number of decimal places in the numeric value; •whether negative values can appear in the numeric value; •whether the numeric value includes a thousands separator, and where; and •text to appear next to the numeric value shown in the counter (for example, to convey a unit of measurement). Formatting is only available for characteristic values whose Function property is Average or Sum. The Format text box is invisible when you select Quantity from the Function menu. By default, VertiGIS FM populates this field with ,.2, which means numbers shown in the counter will have a thousands separator and two decimal places (for example, 1,234.56). You cannot save a dashboard that has a characteristic value object whose Format text box is empty. Refer to Number Formatting. |
||||||
Query |
Optionally, a query whose criteria you want to use to filter the instances of the objects selected in the Entity menu. Instances of the object selected in the Entity menu that do not meet the search criteria in the selected query will not be included in the quantity, average, or sum calculation shown in the characteristic value. Only queries associated with the object selected in the Entity menu can be selected. Refer to Save Queries for instructions on how to create a query. |
||||||
Filter expression |
A filter expression that limits the instances of the data object reflected in the counter. Advanced system knowledge and knowledge of filter expression syntax is required to use this feature. The Filter Expression field is only visible for users assigned roles that have the Define your own filter expressions permission (in the Platform Permissions section) enabled. It is only intended to be used by administrators. |
||||||
Color selection |
The colors you want to display as the characteristic value's background color based on its numeric value. Refer to Color Selection. |
Characteristic Value Examples
The sections below outline examples of how the Function menu is used in characteristic values.
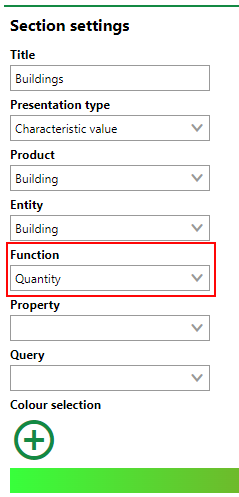
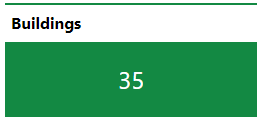
Quantity
In the example below, the characteristic value shows the total number of buildings in the database.
|
|
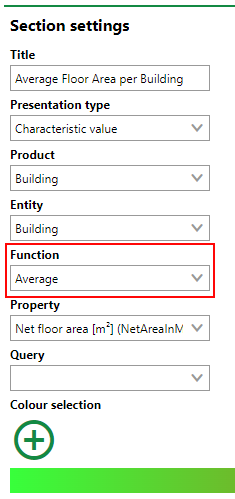
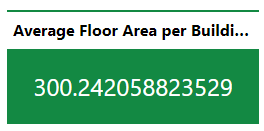
Average
In the example below, the characteristic value shows the average floor area in m2 of all the buildings in the database.
|
|
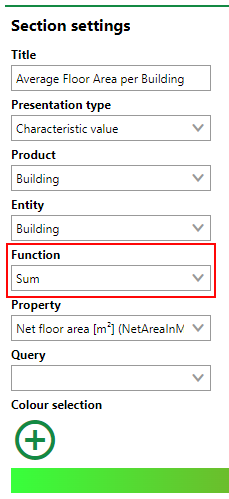
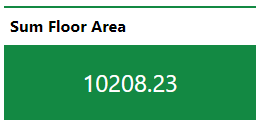
Sum
In the example below, the characteristic value shows the total floor area in m2 of all the buildings in the database.
|
|
Number Formatting
You can configure the inclusion of decimal places, negative values, thousands separators, text, and other symbols using the Format text box in the object settings for a characteristic value. The Format text box is available whenever Average or Sum is selected in the Function menu.
Format Text Box
You can use the +, ., ,, and "" symbols to control how you want VertiGIS FM to format numbers shown in the characteristic value.
Format Input Symbols
Symbol |
Function |
|---|---|
+ |
Ensures the counter only shows positive values. |
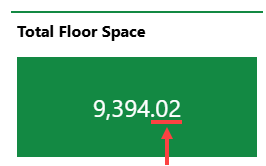
. |
Precedes a number that specifies the number of decimal places in the value shown on the counter.
Two Decimal Places in Counter Value |
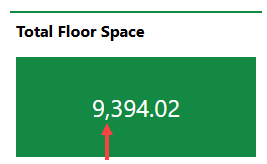
, |
Ensures the value shown on the counter includes a thousands separator, if applicable.
Thousand Separator in Counter Value On the dashboard, the thousands separator can appear as a period or comma, depending on your application's language setting. The application's language setting does not affect the use of periods and commas in the Format text box. |
"" |
Includes text entered between the quotation marks in the counter value. You can include symbols like $ or € without using quotations. Refer to Percentages for information about using the % symbol. |
Enter these symbols as shown in the table below to achieve the desired formatting in your characteristic value.
Format Inputs and Examples
Input |
Description |
Example (When Real Value is 1,234.56) |
|---|---|---|
.0 |
The value includes no decimal places or thousands separator. |
1234 |
+.0 |
The value can only be positive and includes no decimal places or thousands separator. |
1234 |
.2 |
The value includes two decimal places. |
1234.56 |
+.2 |
The value can only be positive and includes two decimal places. |
1234.56 |
,.0 |
The value includes a thousands separator but no decimal places. |
1,234 |
+,.0 |
The value can only be positive and includes a thousands separator but no decimal places. |
1,234 |
,.2 |
The value includes a thousands separator and two decimal places. This is the default value in the Format text box. |
1,234.56 |
+,.2 |
The value can only be positive and includes a thousands separator and two decimal places. |
1,234.56 |
,.2 € |
The value includes a thousands separator, two decimal places, and a € symbol. |
1,234.56 € |
,.2 stk |
The value includes a thousands separator and two decimal places and the text "stk", preceded by a space. |
1,234.56 stk |
,.2 "stk" |
The value includes a thousands separator and two decimal places and the text "stk", not preceded by a space. |
1,234.56stk |
Input |
Description |
Example (When Real Value is 0.56789) |
|---|---|---|
% |
The value is a percentage. It includes no decimal places or thousands separator, but it moves decimals in the real value two places to the right to express the real value as a percentage on the dashboard. |
57%. |
.% |
The value is a percentage with decimal places. It moves decimals in the real value two places to the right to express the real value as a percentage on the dashboard. |
56.789% |
+.% |
The value is a positive percentage that includes all decimal places. |
56.789% |
.2% |
The value is a percentage with two decimal places. It moves decimals in the real value two places to the right to express the real value as a percentage on the dashboard. |
56.79% |
+.2% |
The value is a positive percentage with two decimal places. It moves decimals in the real value two places to the right to express the real value as a percentage on the dashboard. |
56.79% |
Color Selection
Using the Color Selection tool, you can specify what background color you want a characteristic value dashboard object to have based on the numeric value it shows. This is helpful to draw a user's attention to the characteristic value if the value is abnormally high or low and the matter requires attention.
Color Selection Tool
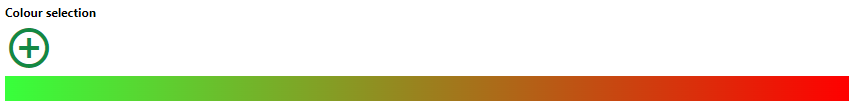
A background color scheme is created by associating different colors with numeric values. VertiGIS FM generates a gradient between the colors, and the numeric value of the dashboard object data at a given moment determines its background color. To create a background color scheme for a characteristic value, add at least two colors to it.
Click the ![]() icon to add a color.
icon to add a color.
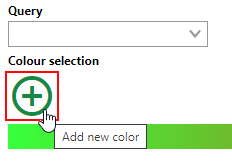
Add a Color Button
Click the square and select a color using the picker.
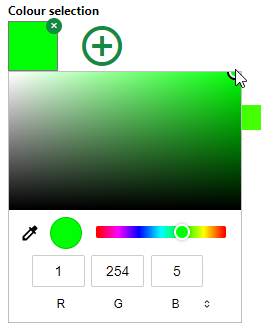
Color Picker
You can also type in a color's RGB code in the R, G, and B text boxes.
In the text box beneath the color, enter a numeric value you want to associate with the color. The characteristic value's background color will be this value when its numeric value is equal to the number you enter here.
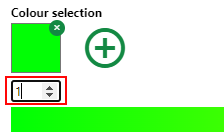
Value for Color
Repeat the steps above to add a second color and corresponding value to the scheme. This creates a gradient beneath the colors you selected.
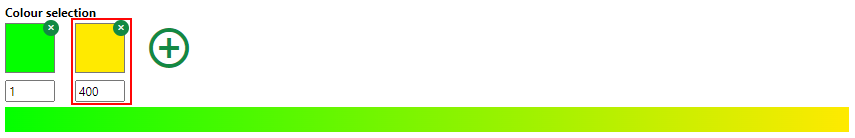
Second Color and Gradient
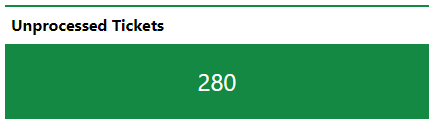
The numeric value of the dashboard object used in this example is 280.
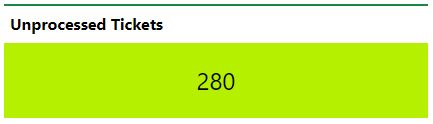
Characteristic Value Object on Dashboard
The background color corresponds to the value's place on the gradient (280) between the green (1) and yellow (400) colors.
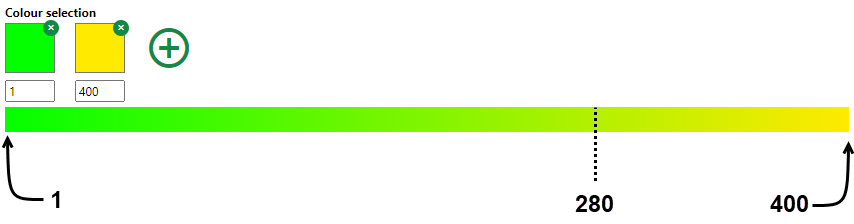
Background Color Selected from Gradient
You can continue adding colors to the characteristic value's color scheme based on its expected numeric values. For example, you may want the background color to convey urgency if, for example, the number of unprocessed service desk reaches an unreasonably high level.
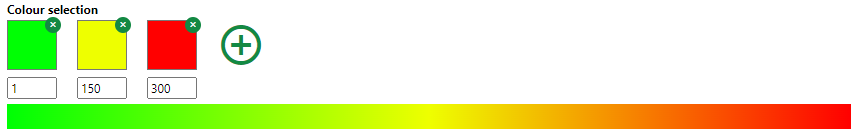
Color Selection with Three Colors
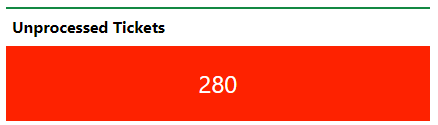
Characteristic Value Using Color Selection Shown Above
If you do not add any colors to the Color Selection section of the characteristic value, the default dark green below is used regardless of the dashboard's object numeric value.
Characteristic Value Default Background Color