The Service Desk is a tool with which you can open tickets to track issues for any assets managed in VertiGIS FM and monitor the actions taken to resolve them.
You can also set up an external Service Desk form, which allows people to open tickets in your system without needing to sign in to VertiGIS FM.
Dashboard
You can open new tickets, view the status of existing tickets, and assess the current volume of tickets on the Service Desk dashboard.
You can access the dashboard from any page in VertiGIS FM by expanding Service Desk in the left pane and clicking dashboard.
Link to Service Desk Dashboard
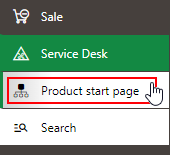
You can also access the Service Desk dashboard on the VertiGIS FM home page by scrolling leftward to the Service Desk icon, expanding the drop-down menu, and selecting Dashboard.
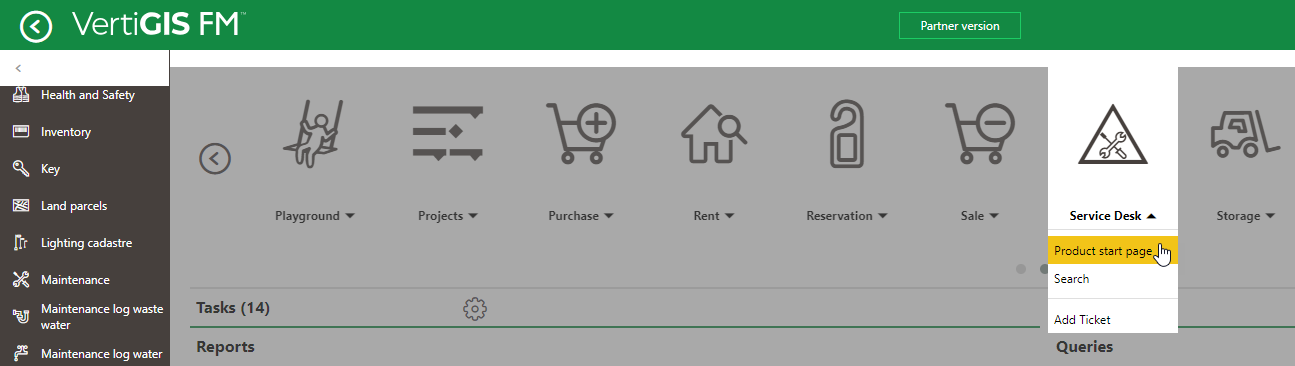
Link to Service Desk Dashboard on VertiGIS FM Home Page
Legacy Dashboard
By default, the Service Desk dashboard is divided into the sections below.
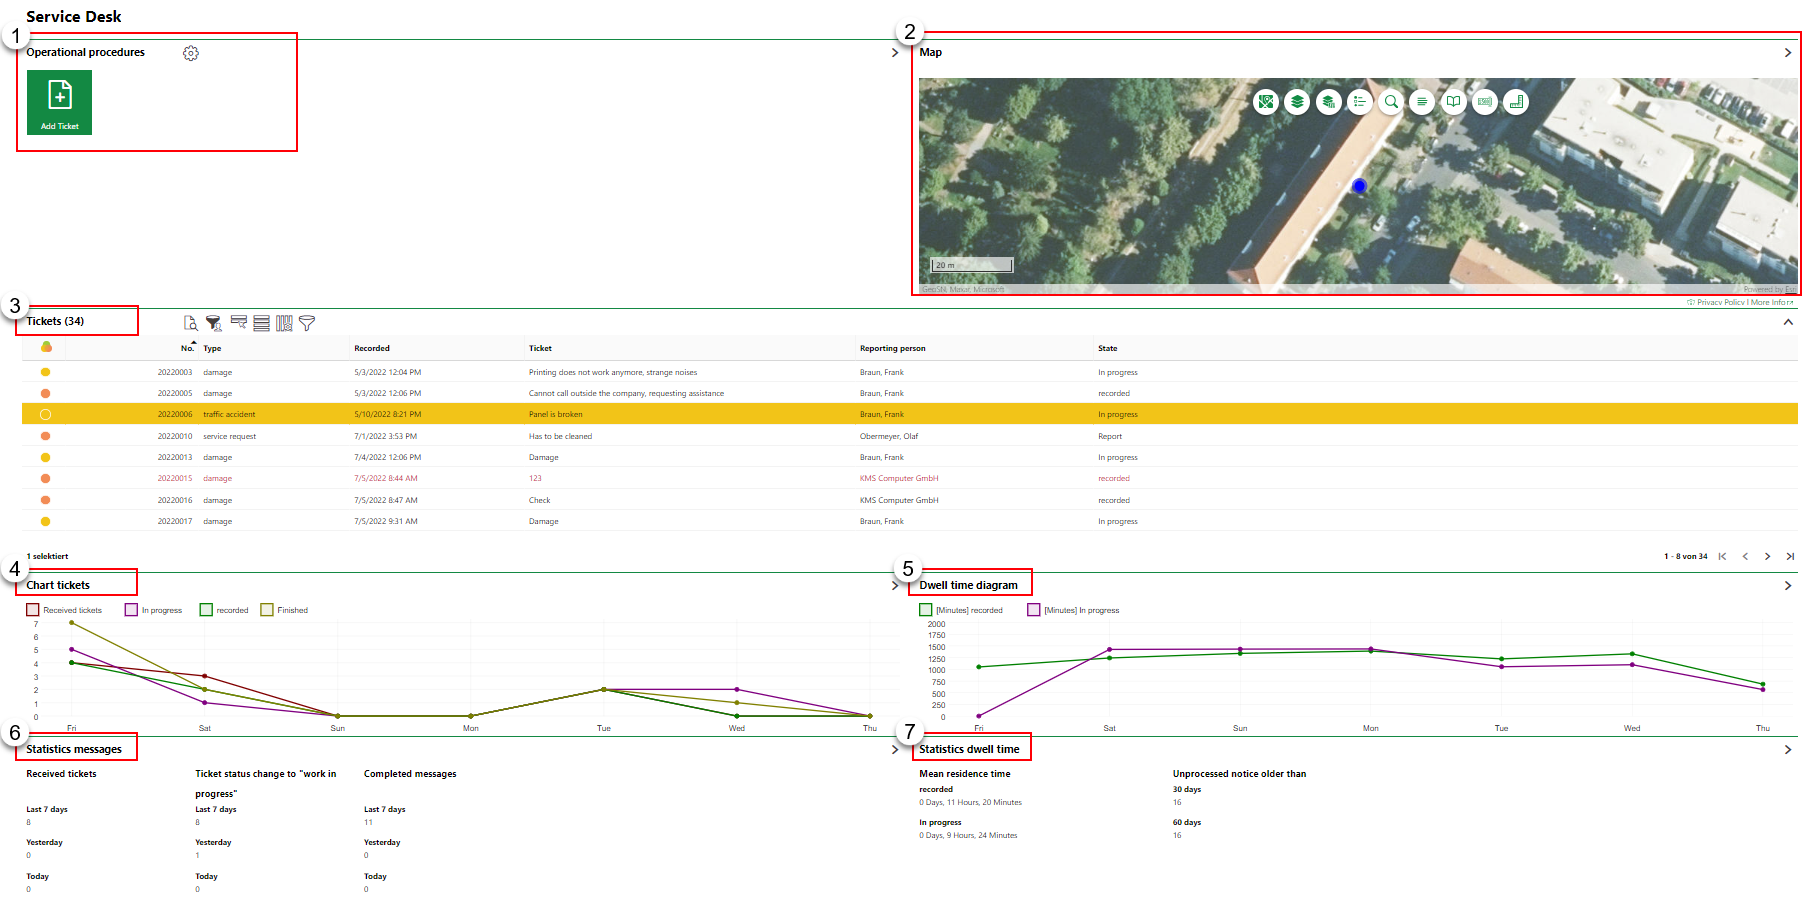
Service Desk Dashboard
Legacy Dashboard Sections
1.Operational Procedures: A quick link to the Add a Ticket workflow.
2.Map: The location of the ticket selected in the Tickets section shown on a map.
3.Tickets: A list of all unresolved tickets in the system and their details.
4.Chart Tickets: A diagram representing the volume of tickets by status (Received, In Progress, Recorded, Finished).
5.Dwell Time Diagram: A diagram representing the amount of time in minutes for which tickets in the system of a given status have existed on any given day over the last week.
6.Statistics Messages: A widget that displays statistics about how many tickets have been opened, started, and closed in the last day, two days, and week.
7.Statistics Dwell Time: A widget that displays statistics about average processing times for tickets.
Operational Procedures
The Operational Procedures section of the Service Desk dashboard includes shortcuts to the following workflows:
Operational Procedures Shortcuts
|
Add Ticket•Shortcut to the Add a Ticket workflow. |

Map
If the Map section is available on the Service Desk dashboard, the tickets' locations are shown on one of two maps:
•on a web map from a VertiGIS Studio application that has been integrated with VertiGIS FM.
•on the Open Street Map (OSM), a basic map that shows the location of assets using location and address data stored in the VertiGIS FM database. The OSM is available for all clients who do not have any VertiGIS Studio projects.
The Map section the site of the Service Desk ticket selected in the Tickets section on a map. The map updates as you select different tickets.
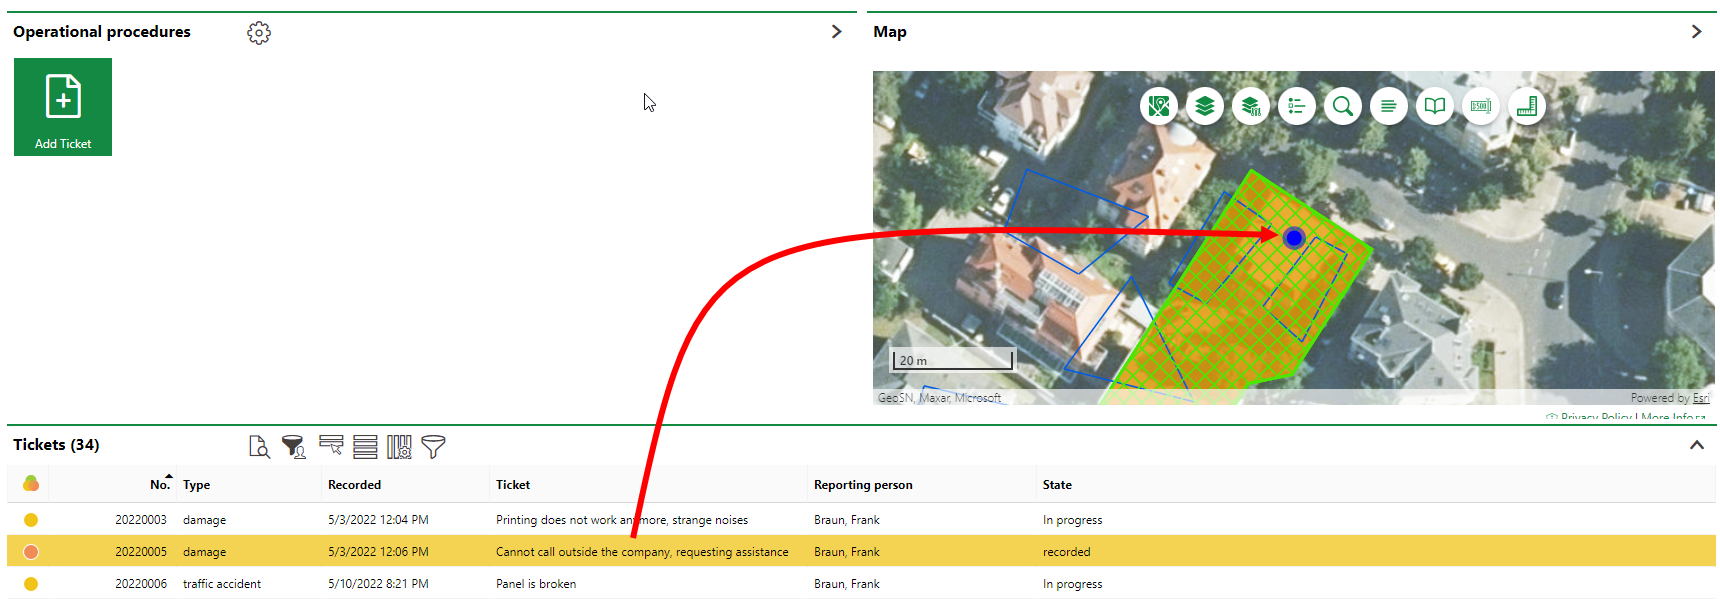
Map Section Showing the Location of the Selected Service Desk Ticket
The location of a service desk ticket is displayed based on the location of the street address of the real estate, building, floor, construction stage, or room associated directly with the ticket. If the ticket is for a device, the location of the ticket is displayed based on the street address of the real estate, building, floor, construction stage, or room selected in the Location section on the device details page. If the ticket is for a door, gate, or window, the location of the ticket is displayed based on the street address of the real estate, building, floor, construction stage, or room selected in the Installed In field on the details page. Refer to Buildings Hierarchy for more information.
Refer to VertiGIS Studio Integration for more information.
The Maps section does not appear on the ticket details page if tickets are not mapped to any layers in an integrated VertiGIS Studio web map and the Open Street Map (OSM) is not activated.
Tickets
The Tickets section lists all the incomplete tickets in the system and their details. You can double-click any ticket in the table to navigate to its Ticket details page. Alternatively, you can select the ticket and click the View Details (![]() ) icon.
) icon.
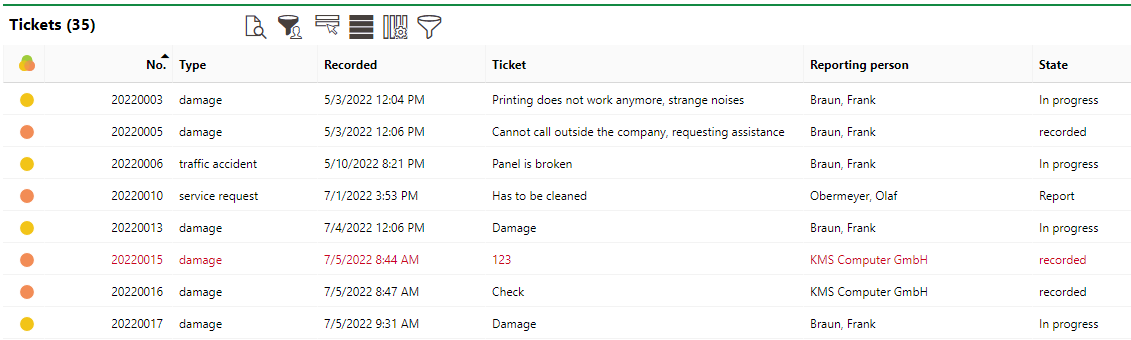
Tickets Section on the Service Desk Dashboard
In the Tickets table, you can
•click the header in any of the columns to sort tickets using that criterion.
•click the Show/Hide Columns (![]() ) icon to show additional columns in the table. Click here for information about the data fields associated with a ticket.
) icon to show additional columns in the table. Click here for information about the data fields associated with a ticket.
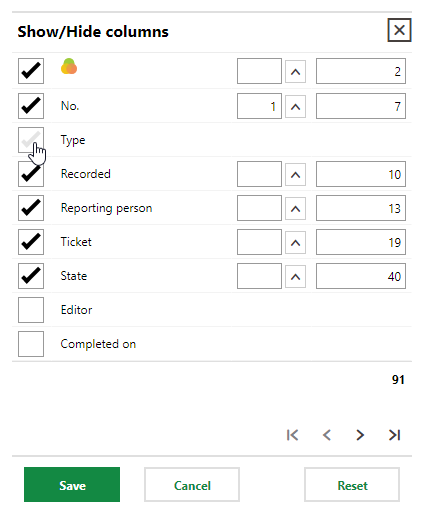
Show or Hide Columns Menu for Tickets Table
Refer to Service Desk Tickets for information about the data fields shown in the table.
When a ticket's status is changed to Complete, the ticket no longer appears in the Tickets section table.
The symbols in the State column indicate the status of the ticket.
Symbol |
Status |
Description |
|---|---|---|
|
Finished |
The issue has been resolved, and the ticket has been reviewed. Finished tickets cannot have their status updated. You can reopen a Finished ticket by adding an answer to it. |
|
Complete |
The issue has been resolved, but it can be reopened if necessary. Generally, a manager or administrator reviews tickets in this state before updating their status to Finished. |
|
In Progress |
Actions to resolve the issue have been started. |
|
Reopened |
A ticket whose status was Finished ( |
|
Report / Reply |
A response is required from the ticket creator before any further actions to resolve the ticket can be taken. |
|
Recorded |
The ticket has been created, but no actions to resolve it have been taken. |


Chart Tickets
The Chart Tickets section displays a diagram reflecting the trend of tickets by status over time. The legend above the diagram indicates which line represents each ticket status.
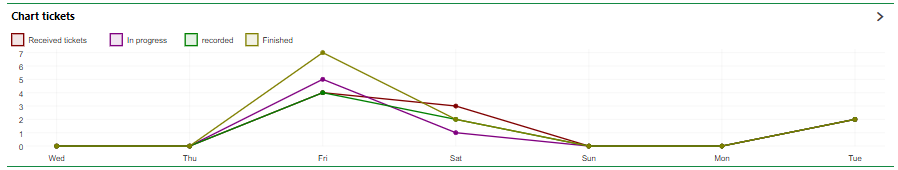
Chart Tickets Diagram on the Service Desk Dashboard
You can show or hide the lines for any of the ticket status trends by clicking on them in the legend above the diagram.
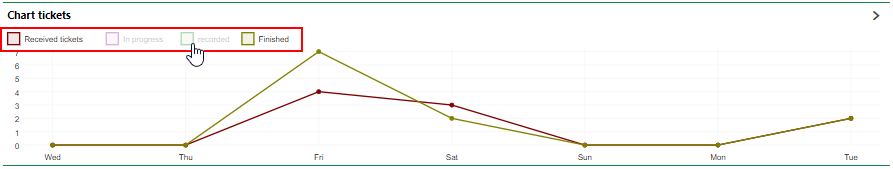
Chart Tickets Diagram with the In Progress and Recorded Trends Hidden
Dwell Time Diagram
The Dwell Time Diagram represents the amount of time in minutes for which tickets in the system of a given status have existed on any given day over the last week. Because there are 1440 minutes in a day, a straight line at 1440 on the y-axis means there is one ticket with a status of Recorded or In Progress that is not being addressed.
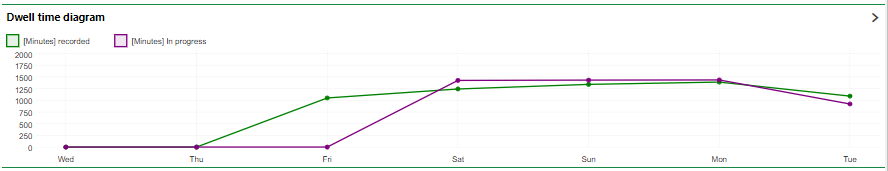
Dwell Time Diagram on the Service Desk Dashboard
You can show or hide the lines for any of the [Minutes] recorded or [Minutes] In Progress by clicking on them in the legend above the diagram.
Statistics Messages
The Statistics Messages section is a widget that displays data on ticket statuses.
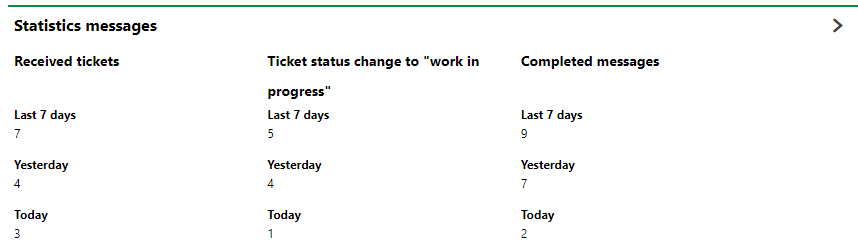
Statistics Messages Section on the Service Desk Dashboard
The Statistics Messages section shows the following type of statistics.
Ticket Status Statistics
Statistic Type |
Description |
|---|---|
Received Tickets |
How many tickets were opened in the last 7 days, yesterday, and today. |
Ticket status change to "work in progress" |
How many new tickets had their status changed to "In Progress" in the last 7 days, yesterday, and today. |
Completed Messages |
How many tickets were closed in the last 7 days, yesterday, and today. |
Statistics Dwell Time
The Statistics Dwell Time section displays statistics on the average amount of time tickets in the system are spending with a Recorded status, are spending with an In Progress status, and are going unprocessed.
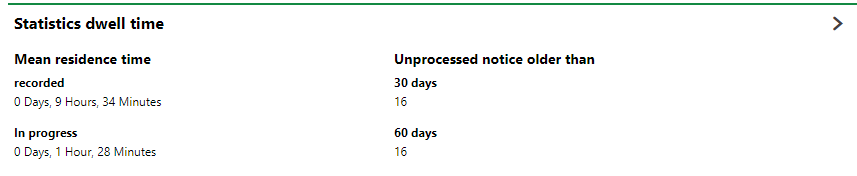
Statistics Dwell Time Section on the Service Desk Dashboard
Dashboard Customization
As a system administrator, you can create a customized dashboard for each VertiGIS FM product and module included in your license. Tools in the dashboard customization feature allow you to design a dashboard that conveys important information to your users, using your own live VertiGIS FM data associated with any assets, data objects, and properties in your system.
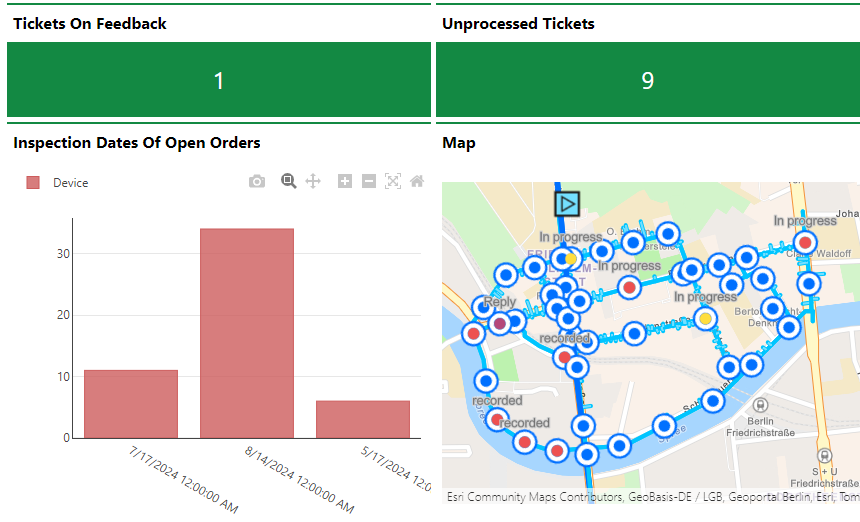
Customized Dashboard with Characteristic Values, Charts, and a Map
Dashboard objects you can add to your start page include KPI metrics, charts, lists, and maps. You can also include any of the template sections from the legacy dashboard in your customized dashboard.
When you create a custom dashboard, you can add any of the items below to it.
Dashboard Object Presentation Types
Presentation Type |
Description |
|---|---|
A counter that reflects the quantity of a data object (e.g., the number of buildings or devices) in the VertiGIS FM database, or the sum or average of a property with a numeric value across all data objects of a given type (e.g., the total floor area across all buildings in the system). |
|
A line, bar, or circle (pie) chart that visualizes data associated with a VertiGIS FM data object. |
|
A list of data objects of a given type (e.g., devices, buildings, or work orders), with their properties sorted into columns so users can search and filter them on the dashboard. |
|
A VertiGIS Studio web map that has been integrated with your VertiGIS FM environment. You can configure it to display a layer mapped to a data object in VertiGIS FM. |
|
An icon and text that links to an external application or website. |
|
Default data objects, like Actions, Operational Procedures, and task-based objects associated with the user signed in to VertiGIS FM. |
To access the dashboard customization page, click the gear icon (![]() ) at the top of the dashboard you want to customize.
) at the top of the dashboard you want to customize.
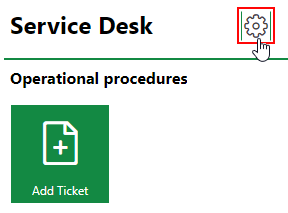
Link to Dashboard Customization Page
Refer to Dashboard Customization for instructions on how to add custom objects to your dashboard.