The Condition Assessment module is used to manage and process comprehensive inspections of buildings and rental agreements, and to configure status ranges your users can select to record condition assessments for elements of specific assets.
The Condition Assessment module is typically bundled with the VertiGIS FM Buildings product but can be used to support assets managed in VertiGIS FM Maintenance, VertiGIS FM Contracts, and other products.
Legacy Dashboard
The Condition Assessment legacy dashboard includes the sections below.
Operational Procedures
The Operational Procedures section of the Condition Assessment dashboard includes shortcuts to important workflows used in the module.
Operational Procedures Template
|
Add Inspection•Shortcut to the workflow to create building inspections and rental agreement inspections for employees in your organization to complete. |
|
Carry Out Inspection•Shortcut to complete building inspections and rental agreement inspections already created. •Opens a page that lists all existing building and rental agreement inspections assigned to the employee signed in to the application. |


Conditions
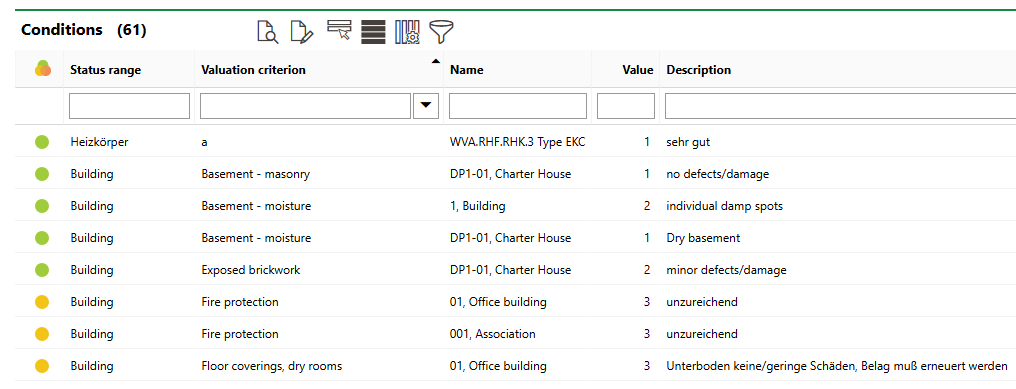
The Conditions section lists previously recorded status range condition assessments for assets in your system.
Conditions Section
You can sort existing condition assessments according to the criteria below.
Conditions Table
Criteria |
Description |
|---|---|
|
The status of any building inspection or rental agreement inspection in which the condition assessment for the asset was recorded, if applicable. |
Status Range |
The type of asset associated with the condition assessment. This can include a hard-coded asset for which you can create condition assessments (for example, a building) or a group or designation in the Device and Systems Structure in VertiGIS FM Maintenance. |
Valuation Criterion |
The entry (part or component of the associated asset) for which the condition assessment was recorded. |
Name |
The name of the asset associated with the entry for which the condition assessment was recorded. |
Value |
The numerical value assigned to the asset's entry as part of the condition assessment. |
Description |
The description associated with the numerical value assigned to the asset's entry. |
Actions
The Actions section lists a shortcut to the Status Ranges page, which lists all the entries within each asset that users can assess, the substance value and use value assigned to each entry, and the status worths users can select for each entry. Refer to Status Ranges for more information.
Dashboard Customization
As a system administrator, you can create a customized dashboard for each VertiGIS FM product and module included in your license. Tools in the dashboard customization feature allow you to design a dashboard that conveys important information to your users, using your own live VertiGIS FM data associated with any assets, data objects, and properties in your system.
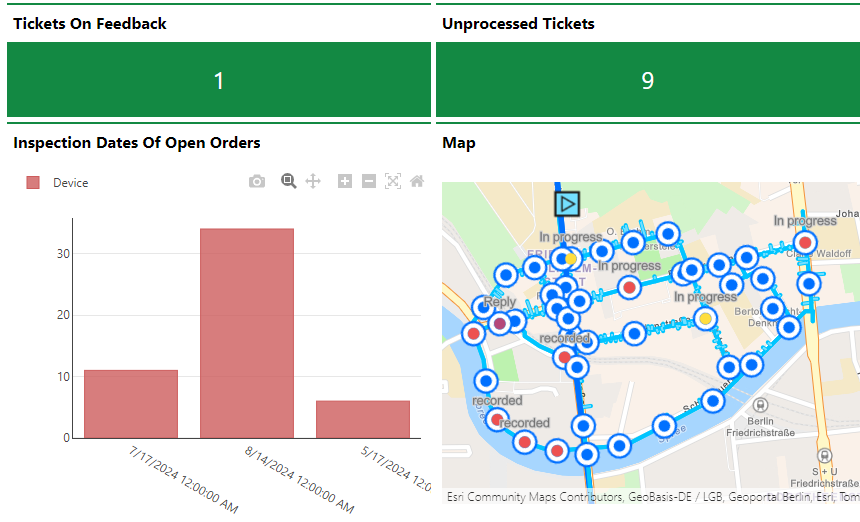
Customized Dashboard with Characteristic Values, Charts, and a Map
Dashboard objects you can add to your start page include KPI metrics, charts, lists, and maps. You can also include any of the template sections from the legacy dashboard in your customized dashboard.
When you create a custom dashboard, you can add any of the items below to it.
Dashboard Object Presentation Types
Presentation Type |
Description |
|---|---|
A counter that reflects the quantity of a data object (e.g., the number of buildings or devices) in the VertiGIS FM database, or the sum or average of a property with a numeric value across all data objects of a given type (e.g., the total floor area across all buildings in the system). |
|
A line, bar, or circle (pie) chart that visualizes data associated with a VertiGIS FM data object. |
|
A list of data objects of a given type (e.g., devices, buildings, or work orders), with their properties sorted into columns so users can search and filter them on the dashboard. |
|
A VertiGIS Studio web map that has been integrated with your VertiGIS FM environment. You can configure it to display a layer mapped to a data object in VertiGIS FM. |
|
An icon and text that links to an external application or website. |
|
Default data objects, like Actions, Operational Procedures, and task-based objects associated with the user signed in to VertiGIS FM. |
To access the dashboard customization page, click the gear icon (![]() ) at the top of the dashboard you want to customize.
) at the top of the dashboard you want to customize.
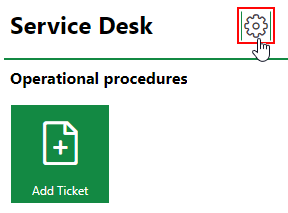
Link to Dashboard Customization Page
Refer to Dashboard Customization for instructions on how to add custom objects to your dashboard.