You can design a report template that uses multiple datasets by using data bands. Data bands and other types of bands are created using the Bands menu in the left pane of the application.
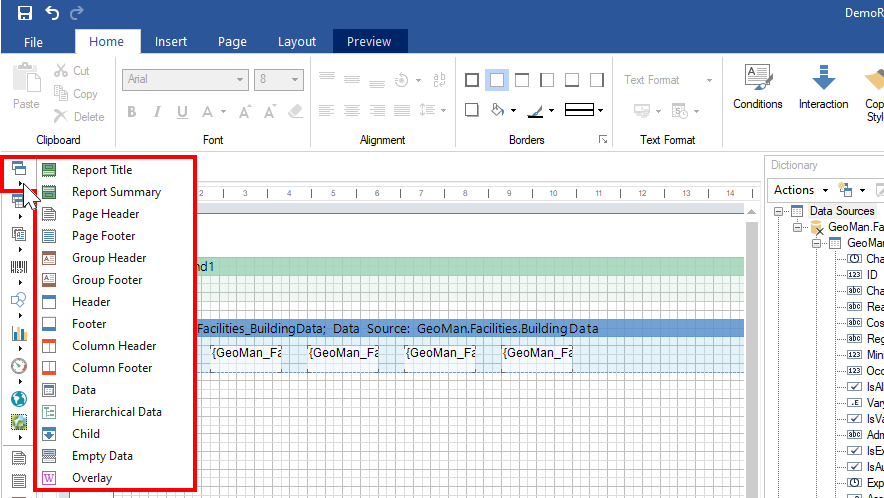
Bands Menu in the Report Manager
Refer to the ePaper Manager Quick Start for instructions on how to create reports in general.
Bands Menu
The following tools are available in the Bands menu.
Bands Menu Tools
Tool |
Description |
|---|---|
|
This band is used to output the report title. It is output in the beginning of a report. Refer to Report Title. |
|
This band is used to output summaries through the entire report. It is output once int he end of a report. |
|
This band is used to output the page header such as page numbers, dates, and other additional information. It is output on the top of each page. |
|
This band is used to output the information on the bottom of each page such as page numbers, dates, and other additional information. Refer to Page Footer. |
|
This band is the basic band for rendering reports with grouping. The components for showing information by this group are placed on the group header. It can be group name, date, or condition of grouping. This band is output in the beginning of each group. |
|
The Group Footer band is used to output the group footer. This band is placed after the Data band. And this is the Data band with which the Group Header bound is band. Each Group Footer band belongs to the specified Group Header bound. The Group Footer band will not be output without the Group Header band. |
|
This band is used to output headers. It is used together with the data band. |
|
This band is used to output summary by the Data band. It is placed under the Data band and is output once after all data rows the Data band outputs. |
|
This band is used to output column headers. The Column Header band is used to output only once. All components which are placed on the band can be output above each column. |
|
This band is used to output footer of columns on the Data band. The Column Footer band is output once under each column. All components which are placed on this band will also be output under each column. |
|
The Data band is connected to the data source and is output as many times as there are rows in the data source. |
|
This band is connected to the data source and output as many times as there are rows in the data source. Data are output as a tree. |
|
The Child band can be used to output two bands on one data row. |
|
This band is used to fill free space on the bottom of a page. This band fills free space on each page of a report. |
|
This band is used to fill free space on the bottom of a page. This band fills free space on each page of a report. |


The descriptions in the table above can be viewed in the Report Manager by hovering over the band in the Bands menu.
Report Title
The Report Title, which contains the report's title and logo, should be used for the section at the top of the report. If you want this area printed at the top of every page generated in the report, use the Page Header band instead.
When you place the Report Title on the report, it is automatically moved the the top of the sheet and adjusted to fit the full width of the sheet. You can adjust the height by clicking on the bottom border and dragging it down.
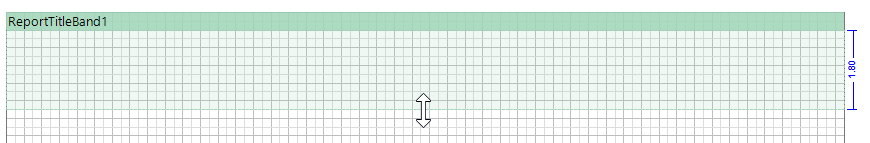
Report Title
You can manage the Report Title's properties by right-clicking the band and selecting Properties.
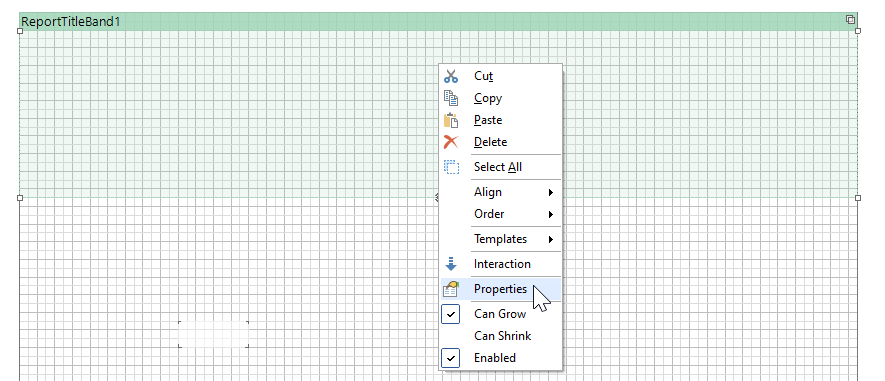
Properties Menu in the Report Title
This opens the band's properties in the right pane of the application. You can manage the band's appearance in the Appearance section or its name in the Design section.
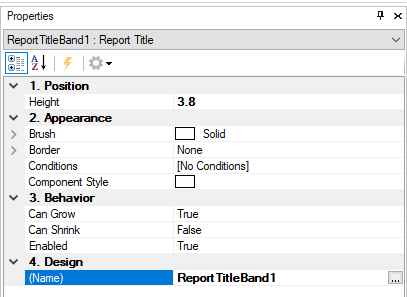
Report Title Properties Panel
Page Footer
The Page Footer band should be used for the recurring band at the bottom of each page in the report. The Page Footer can contain the printing date, page number, or name of the employee who printed the report.
When you add the Page Footer to the report, it is automatically moved to the bottom of the page and expanded to fill the width of the page. You can adjust its height by clicking on the top border of the band and dragging it upwards.

Example Page Footer
You can right-click the band and select Properties to manage the Page Footer properties.
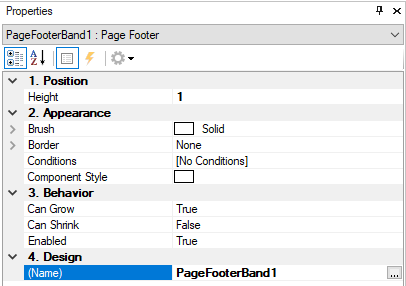
Page Footer Properties
Data Band
The Data band contains the data in the report. It can be placed below an existing report header or page header and is automatically adjusted to fit the full width of the sheet.
When you place the Data band in the report, a Data dialog in which you can select the data source from the XML schema opens. The report will display data from the source you select here.
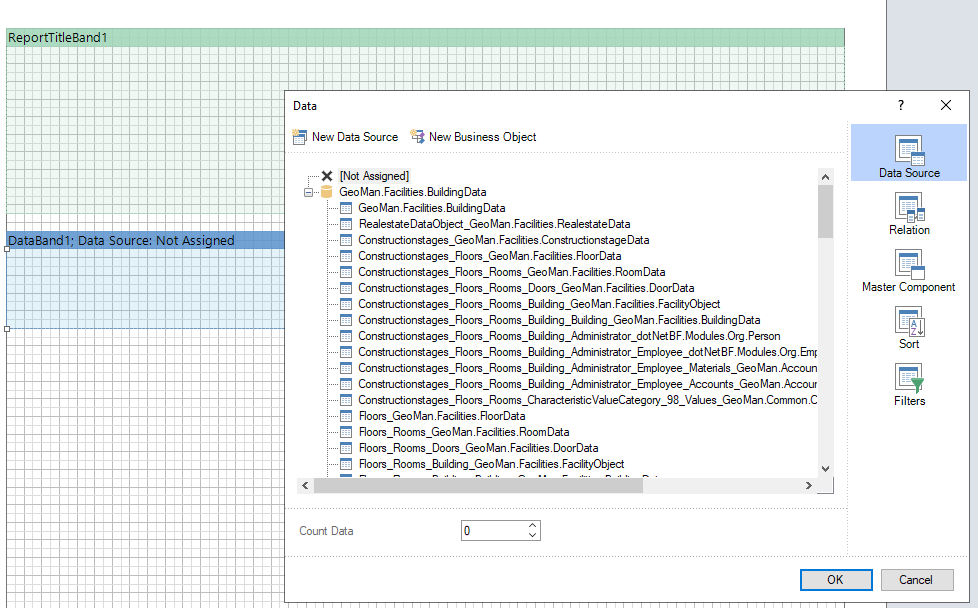
Data Dialog for Newly Placed Data Band
You can re-open the Data dialog by double-clicking in the Data band. You can add additional data sources to be output in the report by dragging them from the XML schema into the report.
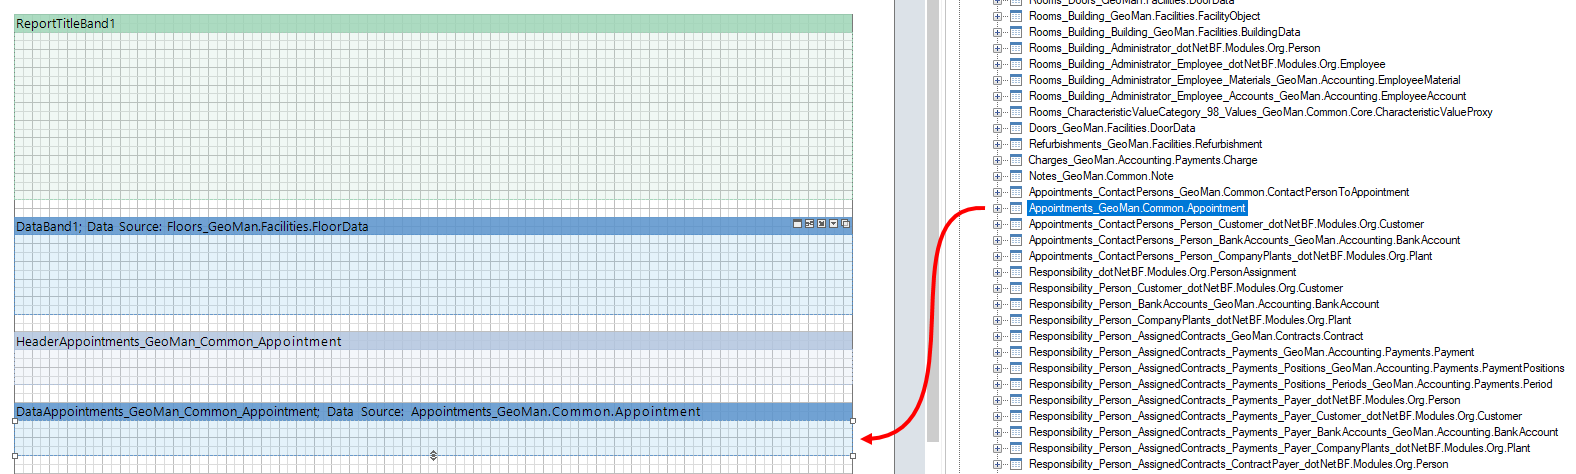
Additional Data Source
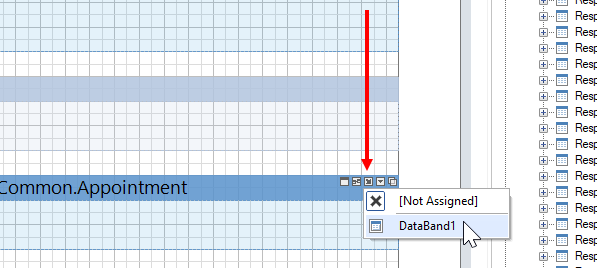
You can establish a link between the data source you dragged onto the report template and the main data source by clicking the second-leftmost icon that appears when you hover over the band.
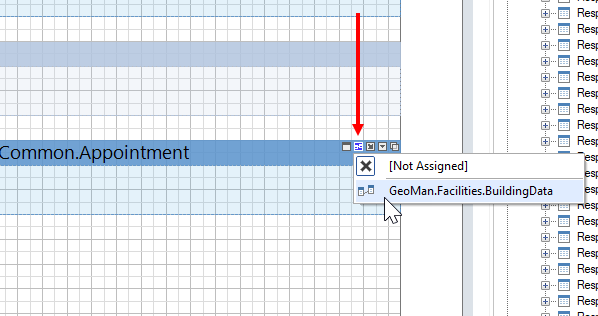
You can establish a link between the data source you dragged onto the report template and the data band you added to the report by clicking the third-leftmost icon that appears when you hover over the band.
You can upload your report into VertiGIS FM after you've connected all the data bands as intended.