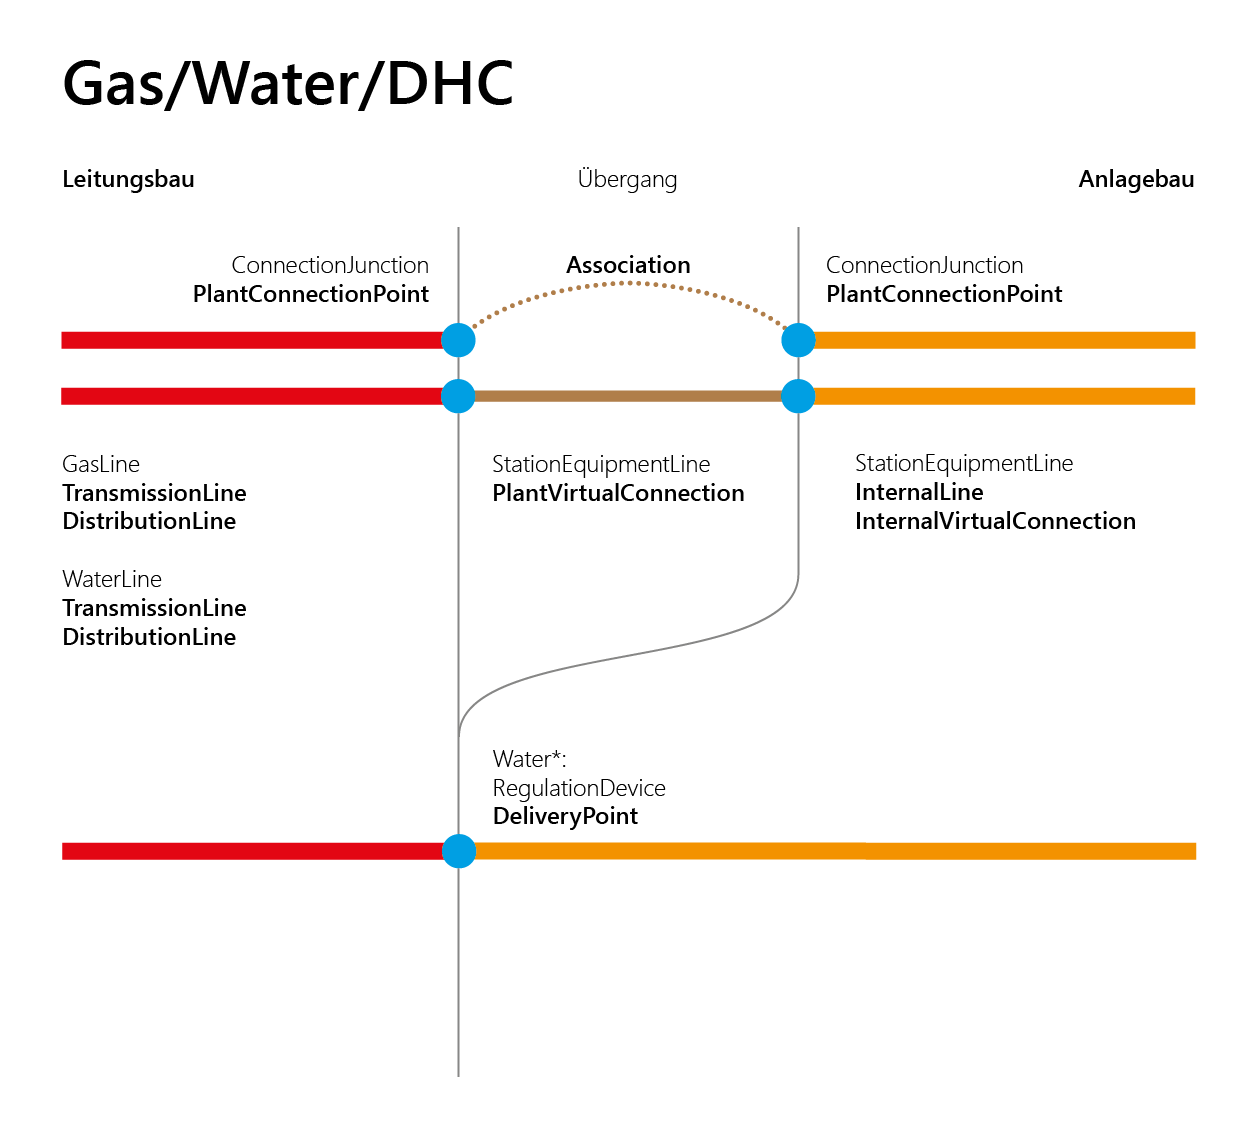
The different types of detection for the transition area between the line construction and the plant construction have different possibilities. To show these with the interrelationships, a schematic diagram was created. This is intended to illustrate the relationships of the various AssetGroup/AssetTypes. At the same time, it can also be a help on how the data should be maintained.
The principle is identical for all Solutions.