Networks Locator is designed to integrate with standard observability solutions used in Kubernetes environments. The application follows cloud-native practices by writing all logs to the container standard output streams (stdout and stderr) in structured JSON format.
The choice of monitoring and logging tools depends on your own operational standards and platform requirements. Any solution capable of collecting Kubernetes metrics, aggregating container logs, providing dashboards, and generating alerts can be used.
Observability Concepts
A complete monitoring solution typically covers the following areas:
•Metrics – quantitative measurements such as request rates, response times, resource consumption, and error rates.
•Logs – detailed event information generated by application components.
•Dashboards – visual representations of system health and performance.
•Alerting – automated notifications when predefined thresholds or conditions are met.
Metrics Collection
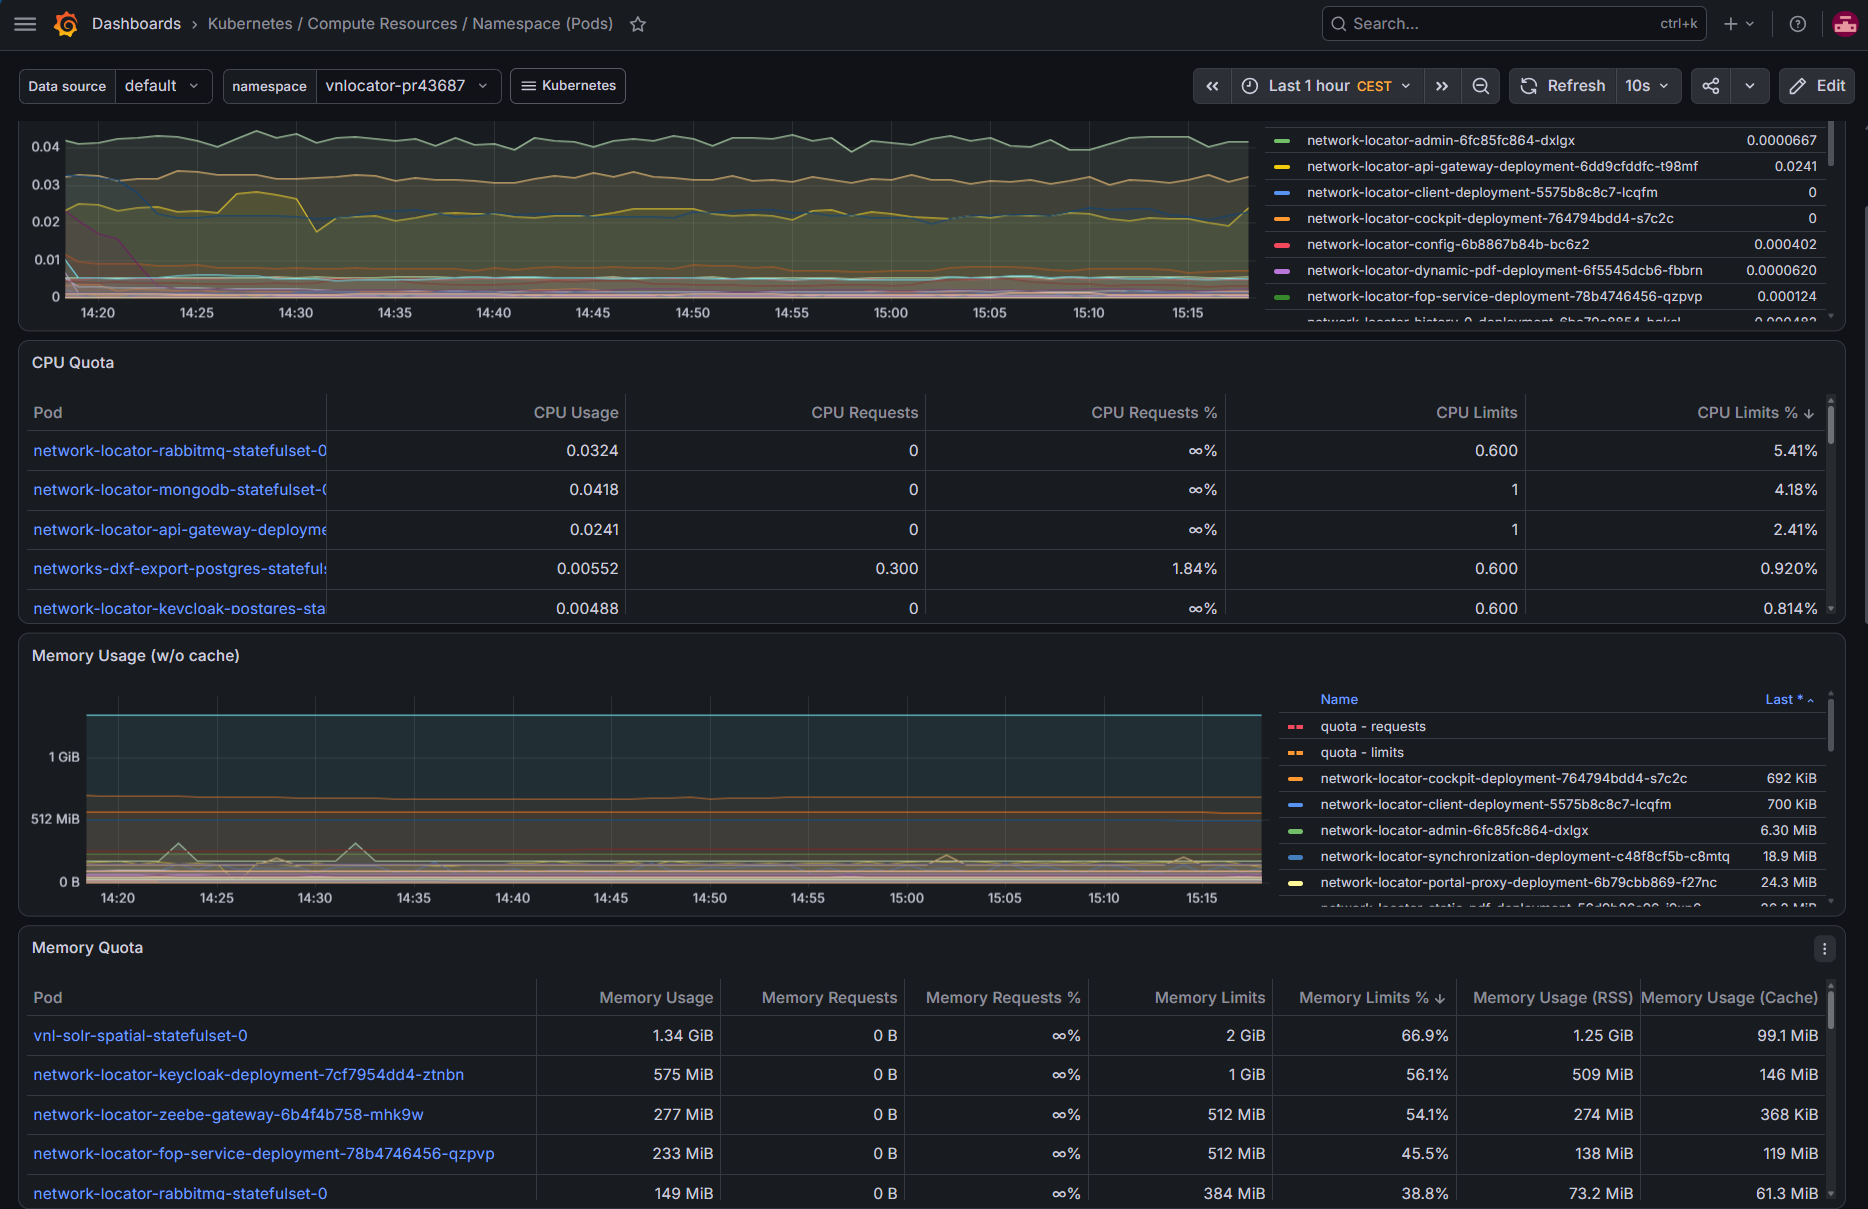
Networks Locator does currently not expose application-specific metrics. Monitoring is therefore primarily based on the metrics provided by Kubernetes and the underlying container platform. Typical metrics that can be collected include:
•Pod status and availability
•Pod restart counts
•Container CPU usage
•Container memory usage
•Network traffic
•Node health and resource utilization
•Deployment and replica status
These metrics allow operators to monitor the health and resource consumption of the deployed workloads and detect infrastructure-related issues.
Logging
All Networks Locator containers write their logs to stdout and stderr in structured JSON format.
This approach follows Kubernetes best practices and enables integration with the platform's logging infrastructure without requiring application-specific log files or additional configuration in the containers.
Example log entry:
{
"timestamp": "2026-07-24T04:07:32.270923562Z",
"sequence": 1281,
"loggerClassName": "org.jboss.logging.Logger",
"loggerName": "com.vertigis.arcgis.gp.AsyncGpTaskExecutor",
"level": "INFO",
"message": "GpJob 'j703cfe5ee3e44828a7af1101b0d7d78c' submitted.",
"threadName": "vert.x-eventloop-thread-0",
"threadId": 41,
"mdc": {},
"ndc": "",
"hostName": "network-locator-process-manager-deployment-7dc7569dc7-5699v",
"processName": "/work/application",
"processId": 1
}
Structured JSON logging provides several advantages:
•Efficient searching and filtering of log entries
•Extraction of structured fields such as log level, service name, request identifiers, and timestamps
•Correlation of events across multiple application components
•Simplified troubleshooting and root-cause analysis
•Creation of log-based alerts, dashboards, and visualizations when supported by the logging platform
Dashboards and Alerting
The selected monitoring solution can provide dashboards and alerts for infrastructure and operational events such as:
•Pod failures
•Container restarts
•Resource exhaustion (CPU or memory)
•Node failures
•Error and warning log events
The exact implementation depends on the chosen observability platform and organizational requirements.
Reference Implementation
The Networks Locator development team has validated the product with the following open-source monitoring stack:
•Prometheus for collecting and storing Kubernetes and container metrics
•Grafana Alloy for collecting and forwarding logs, Kubernetes events, and other telemetry data
•Loki for centralized log aggregation and log analysis
•Grafana for dashboards, queries and visualization
Grafana - Metrics
Sample Screenshot of a metrics dashboard in Grafana