The Kubernetes Dashboard is a robust, web-based user interface designed to simplify the management and monitoring of your Kubernetes cluster. It offers a clear, visual representation of cluster resources and can be particularly useful for monitoring and troubleshooting a Network Locator deployment.
Using the Kubernetes Dashboard is optional. If you already rely on another Kubernetes monitoring tool, the dashboard may not provide significant additional value.
The Kubernetes Dashboard enables you to:
•view workloads such as Deployments, ReplicaSets, and Pods.
•monitor resource usage (CPU, memory, etc.).
•manage configurations, including ConfigMaps and Secrets.
•debug and troubleshoot failed workloads.
•access logs and events for better visibility into your cluster operations.
Security Considerations
The Kubernetes Dashboard provides access to sensitive cluster information, making it crucial to secure access properly. When deploying the Kubernetes Dashboard using the Network Locator Helm Charts, access is automatically secured through the Network Locator security layer, powered by Keycloak.
To log in and access the Dashboard, you must have a user account in the network-locator-internal realm with the vnl_acc_cockpit role assigned.
Features and Usage
After logging into the Kubernetes Dashboard, you can perform the following tasks:
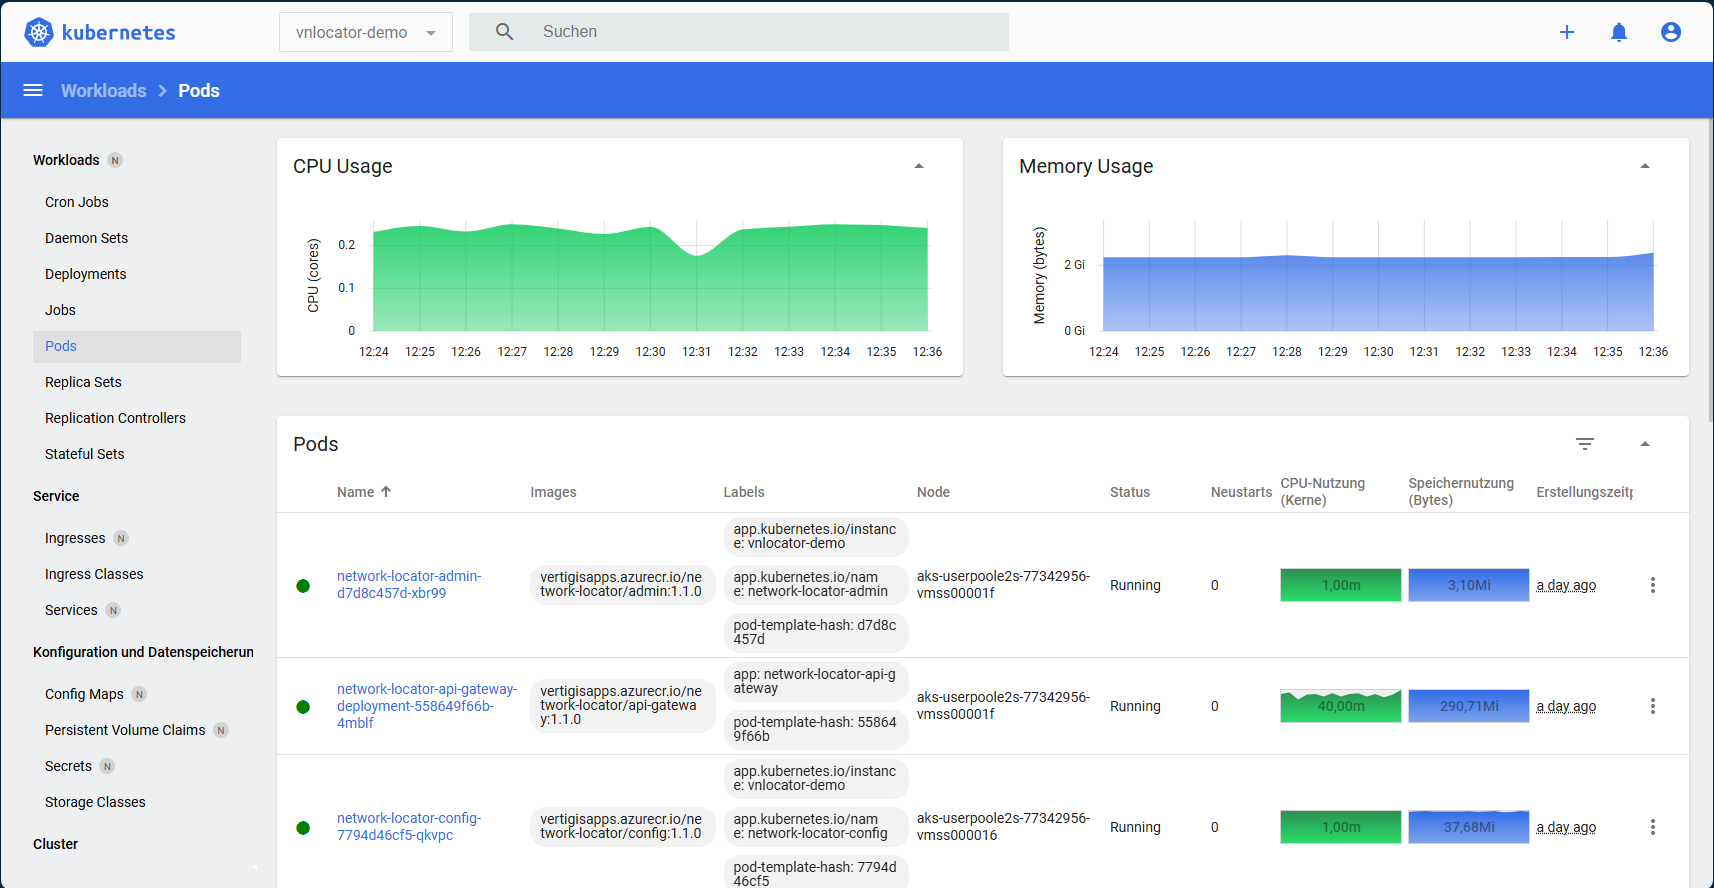
a)View Workloads
•Navigate to the Workloads section to view deployments, pods, ReplicaSets, and other resources.
•Inspect individual pods to view their status, logs, and events.
b)Monitor Resource Usage
•Use the Metrics section to monitor CPU and memory consumption at the pod or node level.
•Identify pods or nodes with high resource usage for optimization.
c)Manage Configuration
•View and edit ConfigMaps, Secrets, and Persistent Volume Claims directly from the dashboard.
•Apply changes dynamically without redeploying your application.
d)Debugging and Troubleshooting
•Use the Logs tab to view logs for individual pods and containers.
•Inspect events for failed or pending workloads to identify issues.